 |
EventDisplays |
AHCAL |
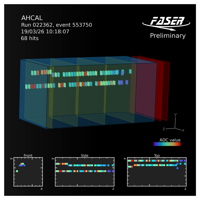
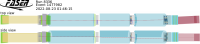
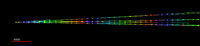
AHCAL Event Display
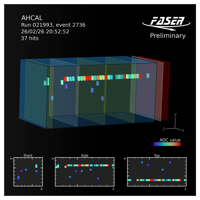
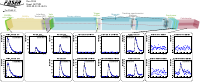
Event display for the FASER AHCAL detector, installed in 2026 in UJ12 area adjacent to FASER. The detector consists of rectangular scintillators and silicon photomultiplers (SiPM). Hits that were digitized above threshold from the SiPM are represented by colored squares, where the color indicated the digitized amplitude. Four layers of scintillators send a fast trigger signal, and are indicated by large yellow (triggered) or gray (not triggered) rectangles. Two large scintillators are positioned in front of the detector to identify muons coming from the ATLAS interaction point. Hits in these are indicated in red. Subplots in the bottom show front, side, and top projections of the event. This event is the first horizontal track recorded once the LHC began operation in 2026. (One veto scintillator was disabled at this time.)
|
 |
EventDisplays |
AHCAL |
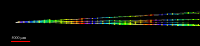
AHCAL Event Display
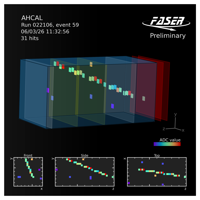
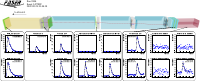
Event display for the FASER AHCAL detector, installed in 2026 in UJ12 area adjacent to FASER. The detector consists of rectangular scintillators and silicon photomultiplers (SiPM). Hits that were digitized above threshold from the SiPM are represented by colored squares, where the color indicated the digitized amplitude. Four layers of scintillators send a fast trigger signal, and are indicated by large yellow (triggered) or gray (not triggered) rectangles. Two large scintillators are positioned in front of the detector to identify muons coming from the ATLAS interaction point. Hits in these are indicated in red. Subplots in the bottom show front, side, and top projections of the event. An inclined track in this event, striking both scintillators, may be a cosmic ray muon.
|
 |
EventDisplays |
AHCAL |
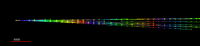
AHCAL Event Display
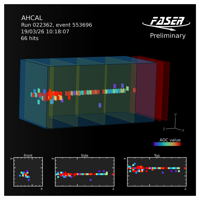
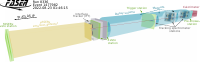
Event display for the FASER AHCAL detector, installed in 2026 in UJ12 area adjacent to FASER. The detector consists of rectangular scintillators and silicon photomultiplers (SiPM). Hits that were digitized above threshold from the SiPM are represented by colored squares, where the color indicated the digitized amplitude. Four layers of scintillators send a fast trigger signal, and are indicated by large yellow (triggered) or gray (not triggered) rectangles. Two large scintillators are positioned in front of the detector to identify muons coming from the ATLAS interaction point. Hits in these are indicated in red. Subplots in the bottom show front, side, and top projections of the event. This event was recorded during LHC collisions and includes a horizontal track and a large energy deposit in the downstream side of the detector.
|
 |
EventDisplays |
AHCAL |
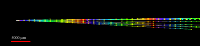
AHCAL Event Display
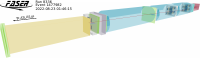
Event display for the FASER AHCAL detector, installed in 2026 in UJ12 area adjacent to FASER. The detector consists of rectangular scintillators and silicon photomultiplers (SiPM). Hits that were digitized above threshold from the SiPM are represented by colored squares, where the color indicated the digitized amplitude. Four layers of scintillators send a fast trigger signal, and are indicated by large yellow (triggered) or gray (not triggered) rectangles. Two large scintillators are positioned in front of the detector to identify muons coming from the ATLAS interaction point. Hits in these are indicated in red. Subplots in the bottom show front, side, and top projections of the event. This event was recorded during LHC collisions and includes two horizontal tracks aligned with the ATLAS interaction point.
|
 |
EventDisplays |
IFT-emulsion-matching |
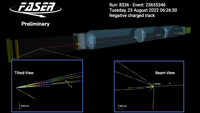
IFT-emulsion matching event display
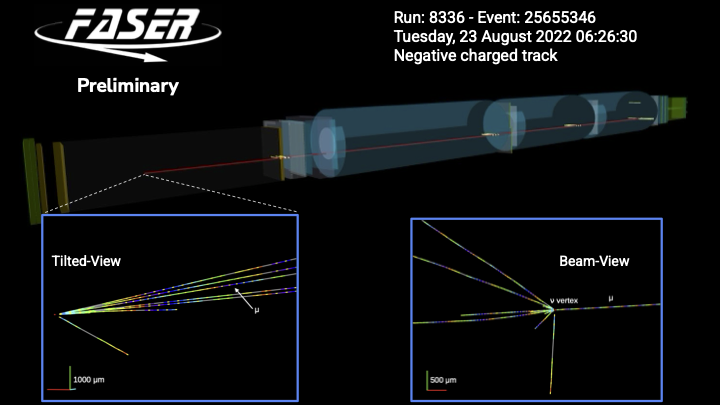
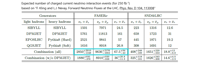
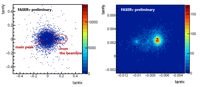
A matched neutrino candidate observed in both the electronic detector and the emulsion detector. This event is interpreted as a neutrino interaction in FASERν, with an associated muon traversing the FASER electronic detector The event was recorded on Tuesday, 23rd August 2022 at 6:26:30 am. Thereconstructed track in the electronic detector has a negative charge. The event contains six IFT clusters with a muon-like topology, while the interaction vertex is identified in the emulsion detector on the 245th plate (out of 730), corresponding to the upstream third of the FASERν detector. The ATLASinteraction point is located 480 m upstream (to the left in the figure). The detected hits in the semiconductor tracker modules are shown with yellow lines, and the reconstructed track is shown in red. The extrapolated track is consistent with the neutrino interaction vertex reconstructed in FASERν. The two lower panels show zoomed views of the vertex in tilted-view and beam-view, as recorded by the tungsten/emulsion detector, with 11 primary tracks.
|
 |
EventDisplays |
run-10417_event-12340 |
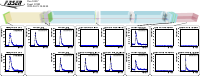
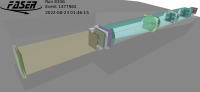
FASER event display with waveforms of scintillator and calorimeter modules
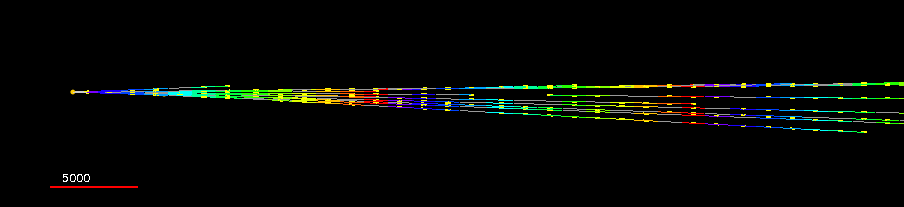
Event display of a muon traversing FASER recorded on 21 April 2023 with 6.8 TeV stable beams. The measured track momentum is 1.30 TeV. The waveforms are shown for signals in scintillator counters and calorimeter modules and are fitted using a Crystal Ball function. All PMT waveforms are consistent with a muon passing through the scintillators and one of the calorimeter modules. The event has been triggered by modules in the FASERν veto station, veto station and trigger station with pulses above 25 mV, and by modules in the pre-shower station with pulses above above 3 mV. The ATLAS interaction point is 480 m to the left of the detector shown. The detected hits in the semiconductor tracker modules are shown with blue lines and the reconstructed track is shown with a red line. In the title of the waveform plots, left and right is defined facing the downstream direction.
|
 |
EventDisplays |
run-10417_event-12340 |
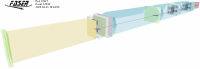
FASER event display
Event display of a muon traversing FASER recorded on 21 April 2023 with 6.8 TeV stable beams. The measured track momentum is 1.30 TeV. The event has been triggered by modules in the FASERν veto station, veto station and trigger station with pulses above 25 mV, and by modules in the pre-shower station with pulses above above 3 mV. The ATLAS interaction point is 480 m to the left of the detector shown. The detected hits in the semiconductor tracker modules are shown with blue lines and the reconstructed track is shown with a red line.
|
 |
EventDisplays |
run-8336_event-1477982 |
FASER event display with waveforms of scintillator and calorimeter modules
Collision event with a muon traversing FASER. The measured track momentum is 21.9 GeV. The waveforms are shown for signals in scintillator counters and calorimeter modules and are fitted using a Crystal Ball function. All PMT waveforms are consistent with a muon passing through the scintillators and one of the calorimeter modules. The event has been triggered by modules in the FASERν veto station, veto station and trigger station with pulses above 25 mV, and by modules in the pre-shower station with pulses above above 3 mV. The ATLAS interaction point is 480 m to the left of the detector shown. The detected hits in the semiconductor tracker modules are shown with blue lines and the reconstructed track is shown with a red line. In the title of the waveform plots, left and right is defined facing the downstream direction.
|
 |
EventDisplays |
run-8336_event-1477982 |
FASER event display
Collision event with a muon traversing FASER. The measured track momentum is 21.9 GeV. All PMT waveforms are consistent with a muon passing through the scintillators and one of the calorimeter modules. The event has been triggered by modules in the FASERν veto station, veto station and trigger station with pulses above 25 mV, and by modules in the pre-shower station with pulses above above 3 mV. The ATLAS interaction point is 480 m to the left of the detector shown. The detected hits in the semiconductor tracker modules are shown with blue lines and the reconstructed track is shown with a red line.
|
 |
EventDisplays |
run-8336_event-1477982 |
FASER event display with top and side view of the detector
Collision event with a muon traversing FASER. Top and side view are shown (the magnets bend the track in the vertical plane). The measured track momentum is 21.9 GeV. All PMT waveforms are consistent with a muon passing through the scintillators and one of the calorimeter modules. The event has been triggered by modules in the FASERν veto station, veto station and trigger station with pulses above 25 mV, and by modules in the pre-shower station with pulses above above 3 mV. The ATLAS interaction point is 480 m to the left of the detector shown. The detected hits in the semiconductor tracker modules are shown with blue lines and the reconstructed track is shown with a red line.
|
 |
EventDisplays |
run-8336_event-1477982 |
FASER event display with cavern
Collision event with a muon traversing FASER. The measured track momentum is 21.9 GeV. All PMT waveforms are consistent with a muon passing through the scintillators and one of the calorimeter modules. The event has been triggered by modules in the FASERν veto station, veto station and trigger station with pulses above 25 mV, and by modules in the pre-shower station with pulses above above 3 mV. The ATLAS interaction point is 480 m to the left of the detector shown. The detected hits in the semiconductor tracker modules are shown with blue lines, the reconstructed track is shown with a red line and the trench in which FASER is placed is shown in grey.
|
 |
EventDisplays |
run-8336_event-1477982 |
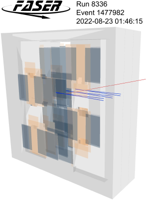
FASER event display with tracking station
Collision event with a muon traversing one of the FASER tracker stations (the interface tracker station (IFT)). The silicon sensors facing forward are shown in dark blue and the readout electronics in orange. The detected hits in the semiconductor tracker modules are shown with blue lines and the reconstructed track is shown with a red line.
|
 |
EventDisplays |
run-8336_event-1477982 |
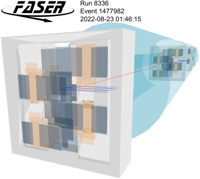
FASER event display with multiple tracking stations
Collision event with a muon traversing FASER. The measured track momentum is 21.9 GeV. The event has been triggered by modules in the scintillator systems. The magnets are shown as light blue cylinders, and the tracking stations as grey cuboids. In each tracking station, the silicon sensors facing forward are shown in dark blue and the readout electronics in orange. The detected hits in the semiconductor tracker modules are shown with blue lines and the reconstructed track is shown with a red line.
|
 |
FASERnu |
2022_module-1 |
Event displays of simulated neutrino interaction vertices
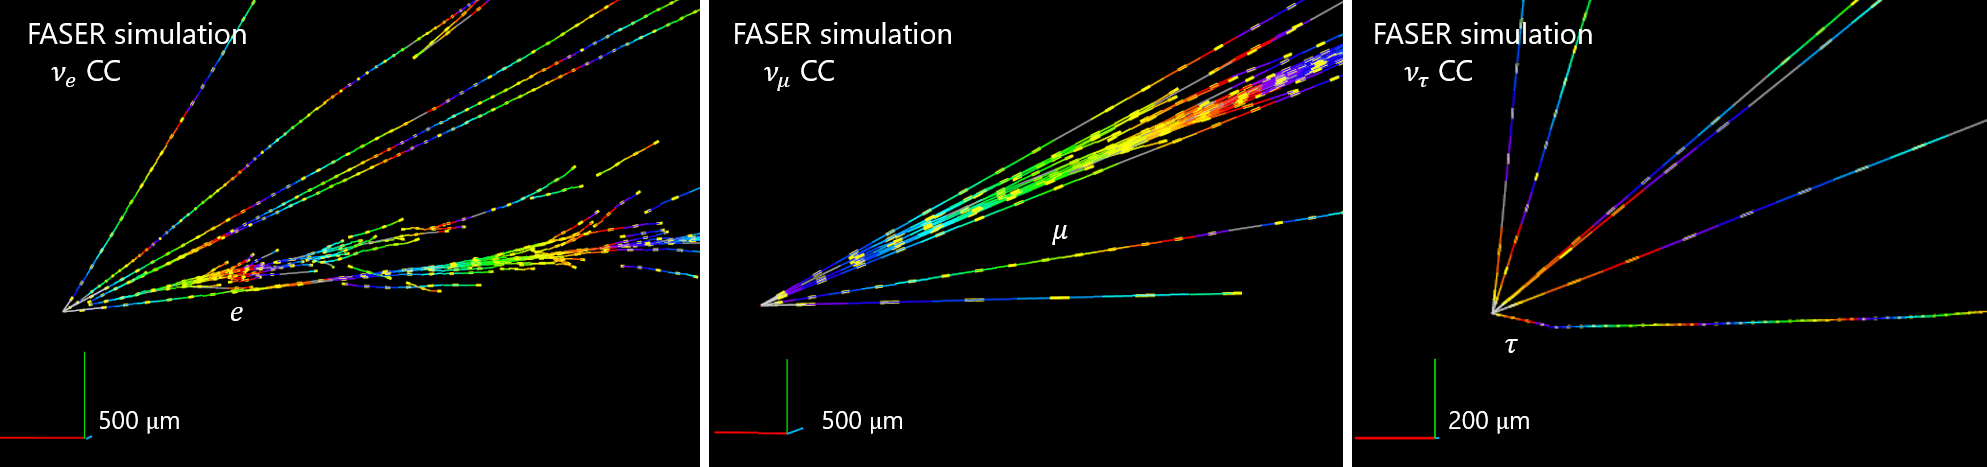
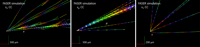
Event displays of simulated neutrino interaction vertices for 433 GeV nue CC, 664 GeV numu CC, and 831 GeV nutau CC. Yellow line segments show the trajectories of charged particles in the emulsion films. The other colored lines are extrapolations of the track hits to the neighboring tungsten plates, and the colors change depending on the depth in the detector.
|
 |
FASERnu |
2022_module-1 |
Expected number of charged current neutrino interaction events
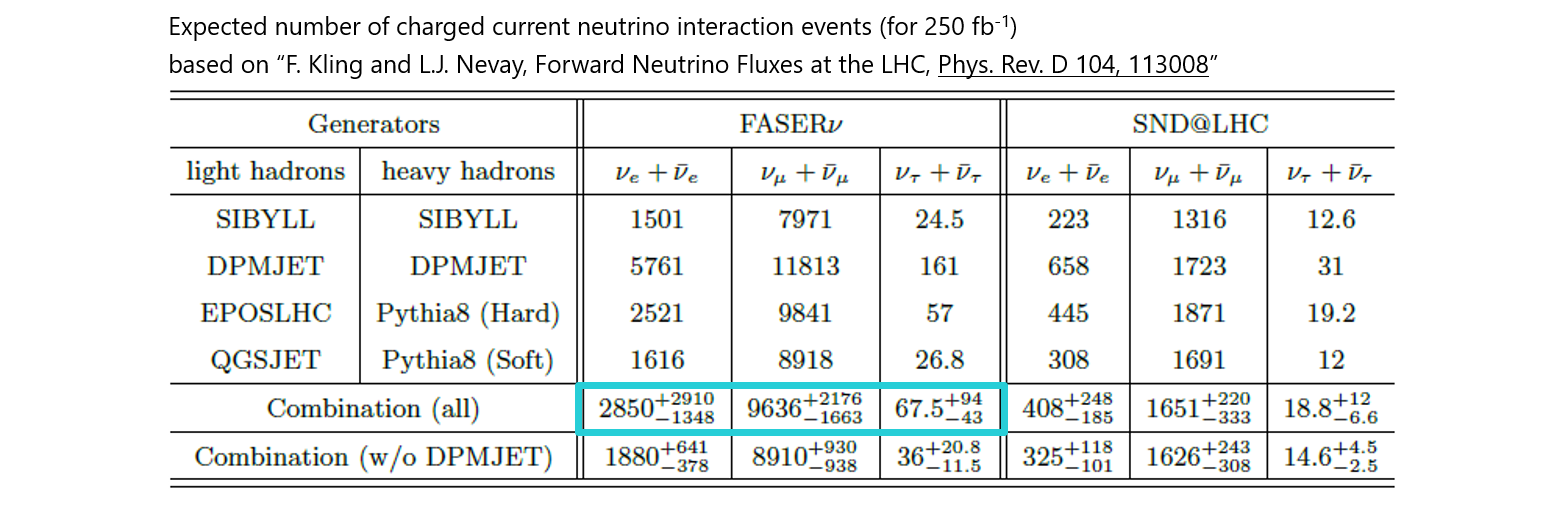
Expected number of charged current neutrino interaction events occurring in FASERnu and SND@LHC during LHC Run 3 with 250 fb-1 integrated luminosity. Predictions from different MC generators are provided.
|
 |
FASERnu |
2022_module-1 |
Thickness uniformity of the tungsten plates
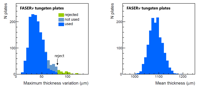
Thickness uniformity of the tungsten plates used for the FASERnu detector was checked with a dedicated device developed by the Collaboration. The thickness was measured semi-automatically at 24 points on each plate, and the maximum difference among the 24 points was checked. A total of 1622 plates were measured, and 1562 plates with a difference smaller than 80 microns were selected as good quality, corresponding to 90% of the measured plates (left). Among them, 1460 plates are used to construct the emulsion detector. The mean thickness of the used plates is 1087 microns, with an RMS of 27 microns (right).
|
 |
FASERnu |
2022_module-1 |
Reconstructed tracks
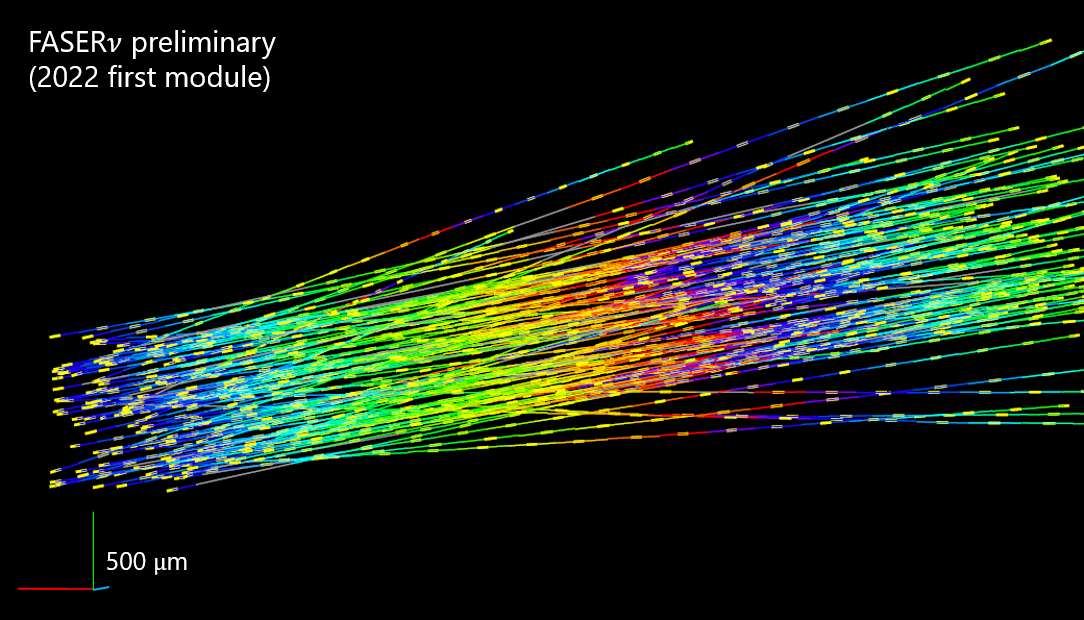
Reconstructed tracks (above ~1 GeV) in 1 mm ~ 1 mm ~ 20 emulsion films from the 2022 first module of the FASERnu detector, which collected 0.5 fb-1 of data. Yellow line segments show the trajectories of charged particles in the emulsion films. The other colored lines are interpolations, and the colors change depending on the depth in the detector. The track density measured in the data sample is 1.2~10^4 /cm2, corresponding to 2.3~10^4 /cm2/fb-1.
|
 |
FASERnu |
2022_module-1 |
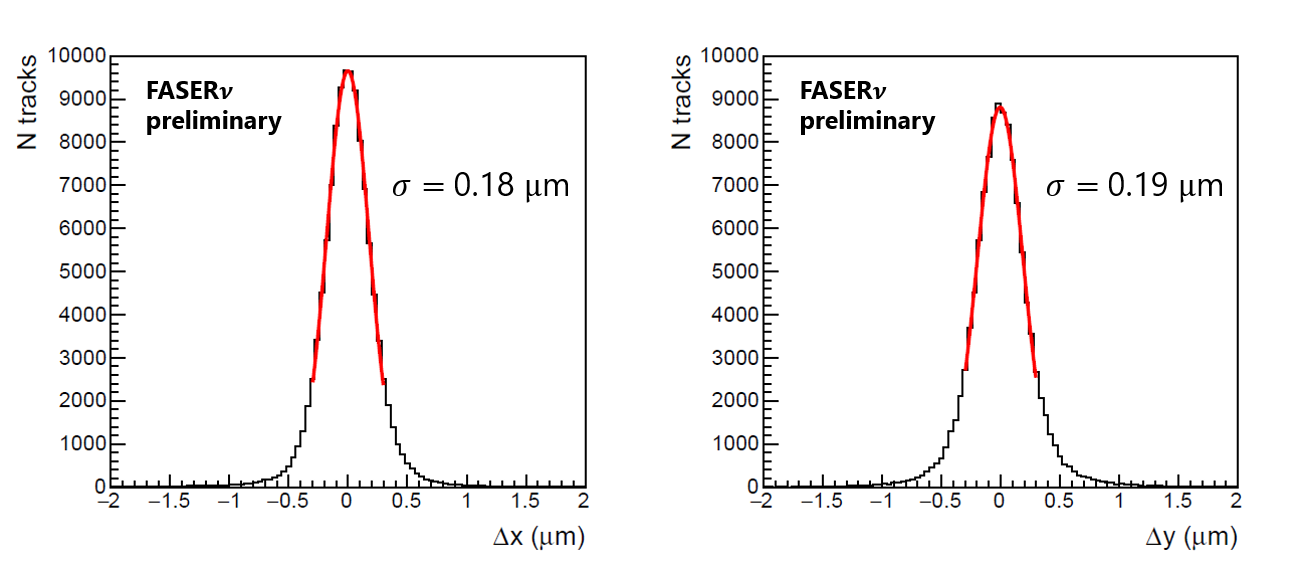
Distributions of the position deviation
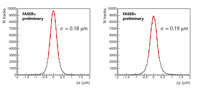
Distributions of the position deviation between the track hits and the straight-line fits to reconstructed tracks, measured in the 2022 first module of the FASERnu detector, are shown. The track hits whose resolution is being probed are not used in the fits. The distributions show position resolutions of ~0.2 microns in the plane transverse to the beam for the case dedicated alignment is applied to 10 emulsion films.
|
 |
FASERnu |
2022_module-1 |
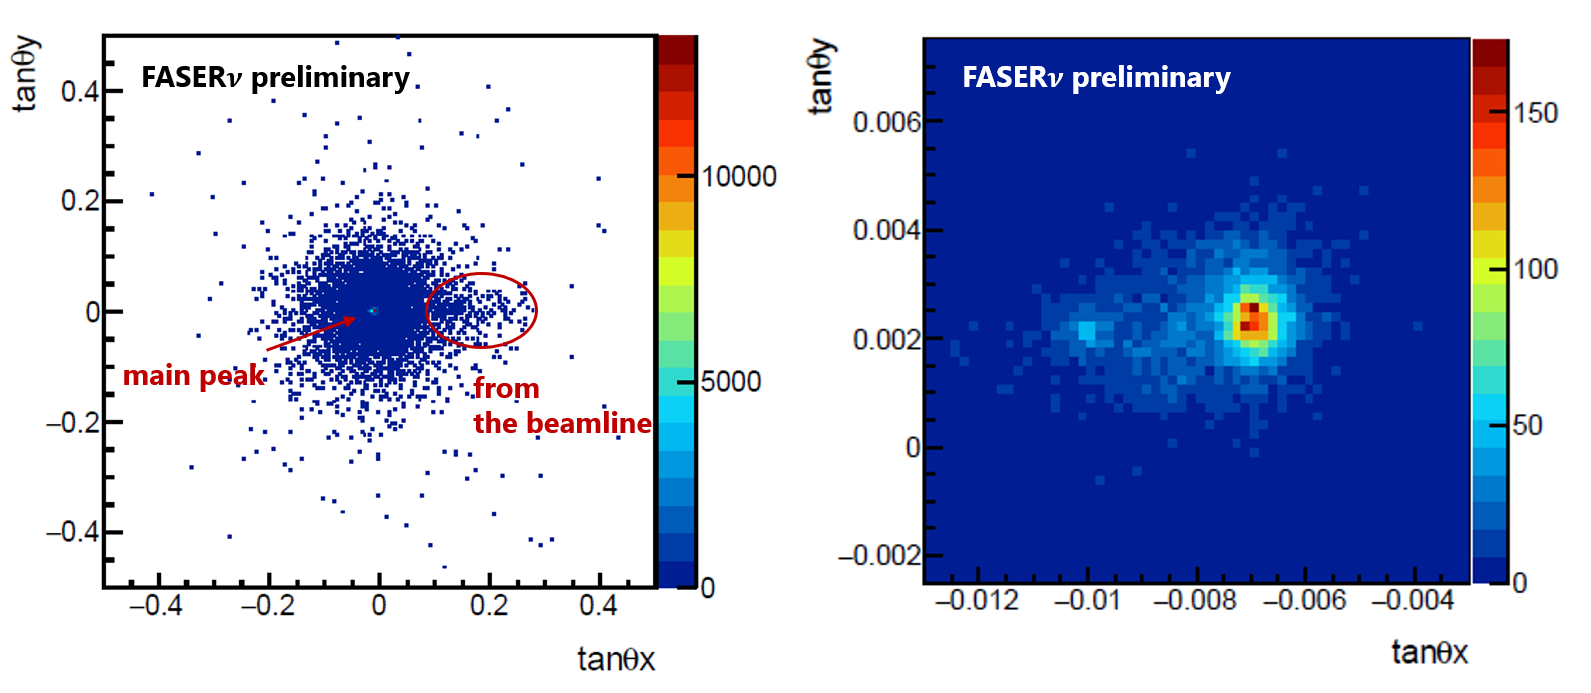
Angular distributions
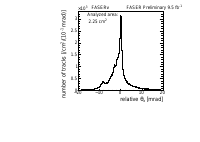
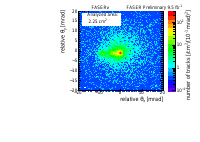
Angular distributions observed using 20 emulsion films in the 2022 first module of the FASERnu detector. The angular coordinates (0, 0) roughly corresponds to the LOS (The detector inclination is not corrected). The large angle tracks are the cosmic rays accumulated on surface. The right figure is a zoom of the left one. There are two peaks separated by 0.003 rad. Both peaks are consistent with particles arriving from the beam line in the vertical plane. The origin of the two-peak structure is under investigation with simulation studies.
|
 |
FASERnu |
2022_module-1 |
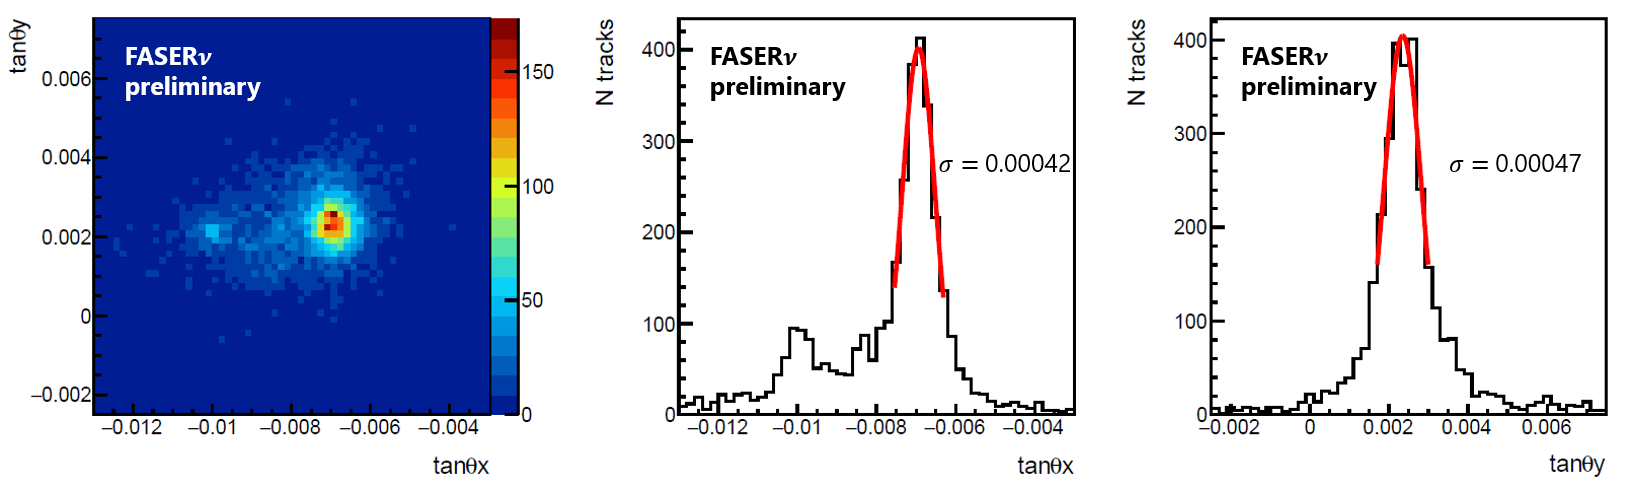
Angular spreads
Angular distributions observed in the 2022 first module of the FASERnu detector. The right figures are projections of the left one. The angular spreads of the peaks are ~0.5 mrad, mainly due to the multiple Coulomb scattering through 100 m of rock.
|
 |
FASERnu |
202303_Pika-nu |
An annimation of the "Pika-nu" event, the first neutrino interaction candidate in FASERnu in Run 3.
See the caption of beam.png for more detail.
|
 |
FASERnu |
202303_Pika-nu |
Beam view of "Pika-nu" event, the first neutrino interaction candidate in FASERnu in Run 3.
The event was recorded between July and August 2022 by the FASERnu tungsten/emulsion detector. There are 11 tracks detected at the vertex, which is 615 um upstream of the first emulsion film. One of the tracks, which is detected at the first film, makes a large EM shower. In the figure, only tracks which start within 100 um from the shower axis are drawn. The shower maximum of this EM shower is at 7.8 X_0 from the vertex, which indicates the shower energy is higher than 100 GeV. As no pairing electron nor pairing gamma is found, the EM shower is unlikely due to pi^0 or gamma. The angle between this particle and average of the others in the transvers plane is 175 degree (Beam view). This is a typical back-to-back topology expected from the kinematics of lepton and hadron system in neutrino CC interactions. All the tracks are emitted very forward. The pseudrapidity of electron is 5.2, the median of the others is 3.7. The background from neutral hadron interactions is predominantly at low energy, so this suggests that this is a neutrino interaction with high purity.
|
 |
FASERnu |
202303_Pika-nu |
Beam view of "Pika-nu" event, the first neutrino interaction candidate in FASERnu in Run 3, in PDF (vector image)
See the caption of beam.png for the detail of the event.
|
 |
FASERnu |
202303_Pika-nu |
X projection of "Pika-nu" event
All the tracks are emitted in forward direction, i.e. the angular spread of particles are very small, which is a signature of a high energy event.
|
 |
FASERnu |
202303_Pika-nu |
X projection of "Pika-nu" event in PDF (vector image)
All the tracks are emitted in forward direction, i.e. the angular spread of particles are very small, which is a signature of a high energy event.
|
 |
FASERnu |
202303_Pika-nu |
Y projection of "Pika-nu" event
All the tracks are emitted in forward direction, i.e. the angular spread of particles are very small, which is a signature of a high energy event.
|
 |
FASERnu |
202303_Pika-nu |
Y projection of "Pika-nu" event in PDF (vector image)
All the tracks are emitted in forward direction, i.e. the angular spread of particles are very small, which is a signature of a high energy event.
|
 |
FASERnu |
202406_EnuReco_prelim |
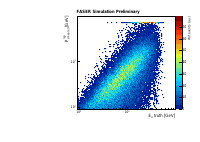
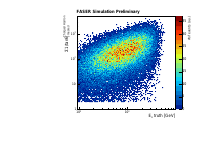
Lepton momentum against True neutrino energy
Lepton momentum as a function of the simulated neutrino energy (“MC truth”) for muon neutrino charge current interactions with at least two charged particles in the final state, using truth level GENIE simulation with smearing to emulate the effect of Multiple Coulomb Scattering through 100 films and tungsten layers. The effect of the 7 TeV upper limit used in the Multiple Coulomb Scattering method is visible near the top of the figure.
|
 |
FASERnu |
202406_EnuReco_prelim |
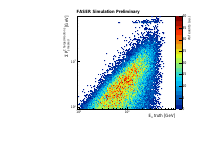
Sum of charged hadron momenta against True neutrino energy
Sum of charged hadron momenta as a function of the simulated neutrino energy (“MC truth”) for muon neutrino charge current interactions with at least two charged particles in the final state, using truth level GENIE simulation with smearing to emulate the effect of Multiple Coulomb Scattering through 100 films and tungsten layers. The effect of the 7 TeV upper limit used in the Multiple Coulomb Scattering method is visible near the top of the figure.
|
 |
FASERnu |
202406_EnuReco_prelim |
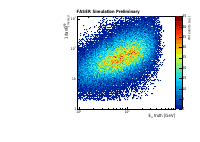
Inverse of lepton tan(theta) against True neutrino energy
Inverse of lepton angle as a function of the simulated neutrino energy (“MC truth”) for muon neutrino charge current interactions with at least two charged particles in the final state, using truth level GENIE simulation with smearing to emulate the current angular resolution.
|
 |
FASERnu |
202406_EnuReco_prelim |
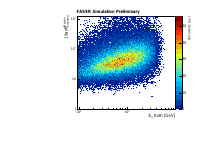
Inverse of the median tan(theta) for all charged particles against True neutrino energy
Inverse of median angle of all charged particles as a function of the simulated neutrino energy (“MC truth”) for muon neutrino charge current interactions with at least two charged particles in the final state, using truth level GENIE simulation with smearing to emulate the current angular resolution.
|
 |
FASERnu |
202406_EnuReco_prelim |
Sum of the inverse of tan(theta) for charged hadrons against True neutrino energy
Sum of the inverse of charged hadron angles as a function of the simulated neutrino energy (“MC truth”) for muon neutrino charge current interactions with at least two charged particles in the final state, using truth level GENIE simulation with smearing to emulate the current angular resolution.
|
 |
FASERnu |
202406_EnuReco_prelim |
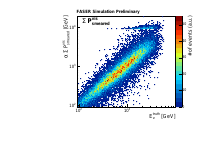
Scaled sum of visible energy against True neutrino energy
Neutrino energy and scaled (MC) sum of visible energy (momentum of charged particles) for muon neutrino charge current samples with at least two charged tracks, using truth level GENIE simulation with smearing to emulate the effect of Multiple Coulomb Scattering through 100 films and tungsten layers. The effect of the 7 TeV upper limit for Pvis used in the Multiple Coulomb Scattering method is visible near the top of the figure.
|
 |
FASERnu |
202406_EnuReco_prelim |
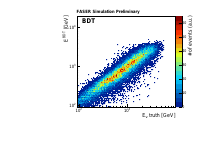
Reconstructed neutrino energy using the TMVA BDT method against True neutrino energy
Neutrino energy reconstruction based on the ROOT TMVA Boosted Decision Tree Regression method for muon neutrino charge current samples with at least two charged tracks, using truth level GENIE simulation with smearing to emulate the effect of Multiple Coulomb Scattering through 100 films and tungsten layers. Lepton momentum, the sum of charged hadron momenta and the inverse of lepton angle are used as input variables.
|
 |
FASERnu |
202406_EnuReco_prelim |
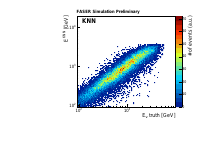
Reconstructed neutrino energy using the TMVA KNN method against True neutrino energy
Neutrino energy reconstruction based on the ROOT TMVA k-Nearest Neighbour Regression method for muon neutrino charge current samples with at least two charged tracks, using truth level GENIE simulation with smearing to emulate the effect of Multiple Coulomb Scattering through 100 films and tungsten layers. Lepton momentum, the sum of charged hadron momenta and the inverse of lepton angle are used as input variables.
|
 |
FASERnu |
202406_EnuReco_prelim |
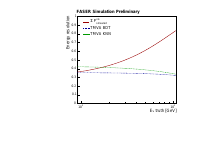
Reconstructed neutrino energy resolution as a function of true neutrino energy in the 100 GeV to 1 TeV range
Reconstructed neutrino energy resolution, found as r.m.s.( (E^reco - E^true)/E^true ) for muon neutrino charged current samples with at least two charged tracks, with smearing (MC). An energy resolution of ~40% (RMS) was obtained for the ROOT TMVA Regression methods investigated (Boosted Decision Tree and k-Nearest Neighbour) in the neutrino energy range of 100 GeV to 1 TeV.
|
 |
FASERnu |
202406_MomMeas_prelim |
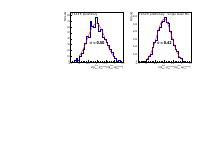
Validation in the real data
Difference between the momentum measurements p_rec^first and p_rec^second divided by the mean of p_rec^first and p_rec^second. p_rec^first is the reconstructed momentum using first 50 plates and p_rec^second is the one using second 50 plates of the tracks penetrating more than 100 plates. Tracks were selected by mean values (p_rec^first + p_rec^second)/2 ranging from 150 to 250 GeV. Left: Data from the 2nd FASERnu module in 2022. Right: Single muon MC. The 20% difference between the fitted sigma of the data and the MC was included as a systematic uncertainty in the FASERnu analysis.
|
 |
FASERnu |
202406_MomMeas_prelim |
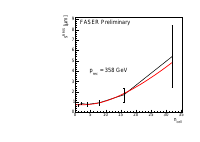
Application of the momentum measurement to one of the muon neutrino events
sRMS as a function of the ncell for the muon candidate in one of the muon neutrino events in the 2nd FASERnu module in 2022, 9.5 fb-1. Ncell is the number of cells, which refers to the number of tungsten plates crossed to measure the scattering. sRMS is the RMS of the second difference s_i = y_{i+2ncell} -2y_{i+ncell} + y_i. Here y_i is the hit position of plate i. The red line shows the result of fitting with the function of multiple Coulomb scattering, and the reconstructed momentum prec was found to be 358 GeV.
|
 |
FASERnu |
202406_MomMeas_prelim |
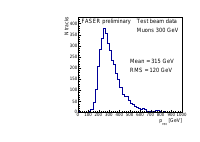
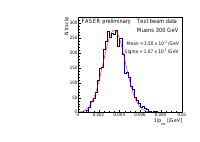
Validation with the test beam data in 2023
Reconstructed momentum distribution for 300 GeV muons in the test beam data collected in August 2023, at the H4 beam line at the SPS. The analyzed detector consisted of 60 layers and was irradiated with 300 GeV muons and 200 GeV electrons. Tracks penetrating more than 55 plates and within 2 mrad from the angular peak in both x and y directions were selected. The momentum was measured by the multiple Coulomb scattering in the detector. The test beam results agree well with the simulation predictions, including the presence of a toil towards higher momentum.
|
 |
FASERnu |
202406_MomMeas_prelim |
Validation with the test beam data in 2023
Reconstructed inverse momentum distribution for 300 GeV muons in the test beam data collected in August 2023, at the H4 beam line at the SPS. The analyzed detector consisted of 60 layers and was irradiated with 300 GeV muons and 200 GeV electrons. Tracks penetrating more than 55 plates and within 2 mrad from the angular peak in both x and y directions were selected. The momentum was measured by the multiple Coulomb scattering in the detector. The test beam results agree well with the simulation predictions. The central momentum of 286 GeV is extracted from the inverse of the mean of the fitting. The resolution of 30% is calculated from the sigma of this distribution.
|
 |
FASERnu |
charm |
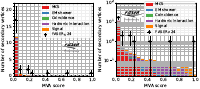
MVA distribution for MC and data for the secondary vertices in the partial unblinding
The MVA distribution of the MC (colored filled bars) is compared with the data (black dots). The data corresponds to the secondary vertices from the neutrino vertices published in the first electron and muon neutrino cross section paper from FASER in 2024. The figure format is identical to the one in the CONF note pulished for Moriond 2026 (https://cds.cern.ch/record/2956186/). Some minor changes have been applied to the data processing and secondary vertex selection, namely that a dedicated EM shower rejection algorithm has been included, to reduce the number of fake daughter tracks, and the track reconnection has been improved. Some minor changes to the neutrino event selection and MC reconstruction have also been implemented, which better reflects the conditions in the data.
|
 |
Physics |
muon_analysis_June2024 |
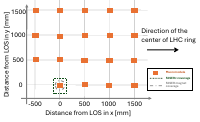
The schematic view of the muon module position in x and y directions
The schematic view of the muon module position in x and y directions.
|
 |
Physics |
muon_analysis_June2024 |
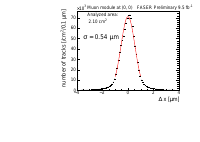
The possition accuracy of the muon module in the x direction
Distribution of Δx for the muon module at (x, y) = (0, 0) mm from the Line of Sight. Δx is defined by the position deviation of the track hits with respect to a linear-fit line for the reconstructed tracks in the x direction. The number of tracks are normalized by the size of the analysis area.
|
 |
Physics |
muon_analysis_June2024 |
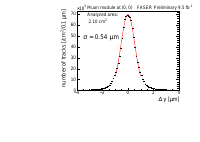
The position accuracy of the muon module in the y direction
Distribution of Δy for the muon module at (x, y) = (0, 0) mm from the Line of Sight. Δy is defined by the position deviation of the track hits with respect to a linear-fit line for the reconstructed tracks in the y direction. The number of tracks are normalized by the size of the analysis area.
|
 |
Physics |
muon_analysis_June2024 |
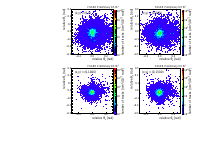
The wide-range angular distributions of the muon modules
the wide-range angular distributions of the four muon modules at (x, y) = (0, 0) mm (top left), (x, y) = (0, 500) mm (top right), (x, y) = (0, 1000) mm (bottom left), and (x, y) = (0, 1500) mm (bottom right). The angular coordinates (θx, θy)=(0, 0) is the mean of the angular distribution for each module. The analyzed area is 3.61 cm2 and the number of tracks is normalized by this value.
|
 |
Physics |
muon_analysis_June2024 |
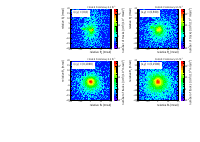
The two-dimensional narrow-range angular distributions of the muon modules
the angular distributions of the four muon modules at (x, y) = (0, 0) mm (top left), (x, y) = (0, 500) mm (top right), (x, y) = (0, 1000) mm (bottom left), and (x, y) = (0, 1500) mm (bottom right). The angular coordinates (θx, θy)=(0, 0) is the mean of the angular distribution for each module. The analyzed area is 3.61 cm2.
Peak structures of background muons depend on the module position. Multiple peaks in θx are expected from the decay of the hadron produced at IP and the interaction with the LHC magnets in the simulation. The origin of the peak structure is under investigation.
|
 |
Physics |
muon_analysis_June2024 |
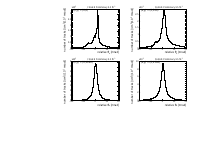
The angular sitributions of the muon modules in the x angle
the angular distributions of the four muon modules at (x, y) = (0, 0) mm (top left), (x, y) = (0, 500) mm (top right), (x, y) = (0, 1000) mm (bottom left), and (x, y) = (0, 1500) mm (bottom right). The angular coordinates (θx, θy)=(0, 0) is the mean of the angular distribution for each module. The analyzed area is 3.61 .
Peak structures of background muons depend on the module position. Multiple peaks in θx are expected from the decay of the hadron produced at IP and the interaction with the LHC magnets in the simulation. The origin of the peak structure is under investigation.
|
 |
Physics |
muon_analysis_June2024 |
The angular distribution of the 2nd FASERν module in 2022 in the x angle
the angular distribution in a 1.5 cm x 1.5 cm square at (x, y) = (11, -54) mm from the LOS of the 2nd FASERν module in 2022. The angular coordinates (θx, θy)=(0, 0) is the mean of the angular distribution. Multiple peaks in θx are expected from the decay of the hadron produced at IP and the interaction with the LHC magnets in the simulation. The origin of the peak structure is under investigation.
|
 |
Physics |
muon_analysis_June2024 |
The two-dimensional angular distribution of the 2nd FASERν module in 2022
the angular distribution in a 1.5 cm x 1.5 cm square at (x, y) = (11, -54) mm from the LOS of the 2nd FASERν module in 2022. The angular coordinates (θx, θy)=(0, 0) is the mean of the angular distribution. Multiple peaks in θx are expected from the decay of the hadron produced at IP and the interaction with the LHC magnets in the simulation. The origin of the peak structure is under investigation.
|
 |
Physics |
neutrino-cross-section |
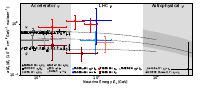
Neutrino cross section divided by neutrino energy
Measurements of the charged-current neutrino-nucleon cross section divided by neutrino energy as a function of the neutrino energy with FASERν (blue), FASER (red) and previous experiments (gray). The dashed lines show the expected cross section using the Bodek-Yang model.
|
 |
Physics |
neutrino-cross-section |
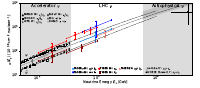
Neutrino cross section
Measurements of the charged-current neutrino-nucleon cross section as a function of the neutrino energy with FASERν (blue), FASER (red) and previous experiments (gray). The dashed lines show the expected cross section using the Bodek-Yang model.
|
 |
Scintillators |
DualCalo2024 |
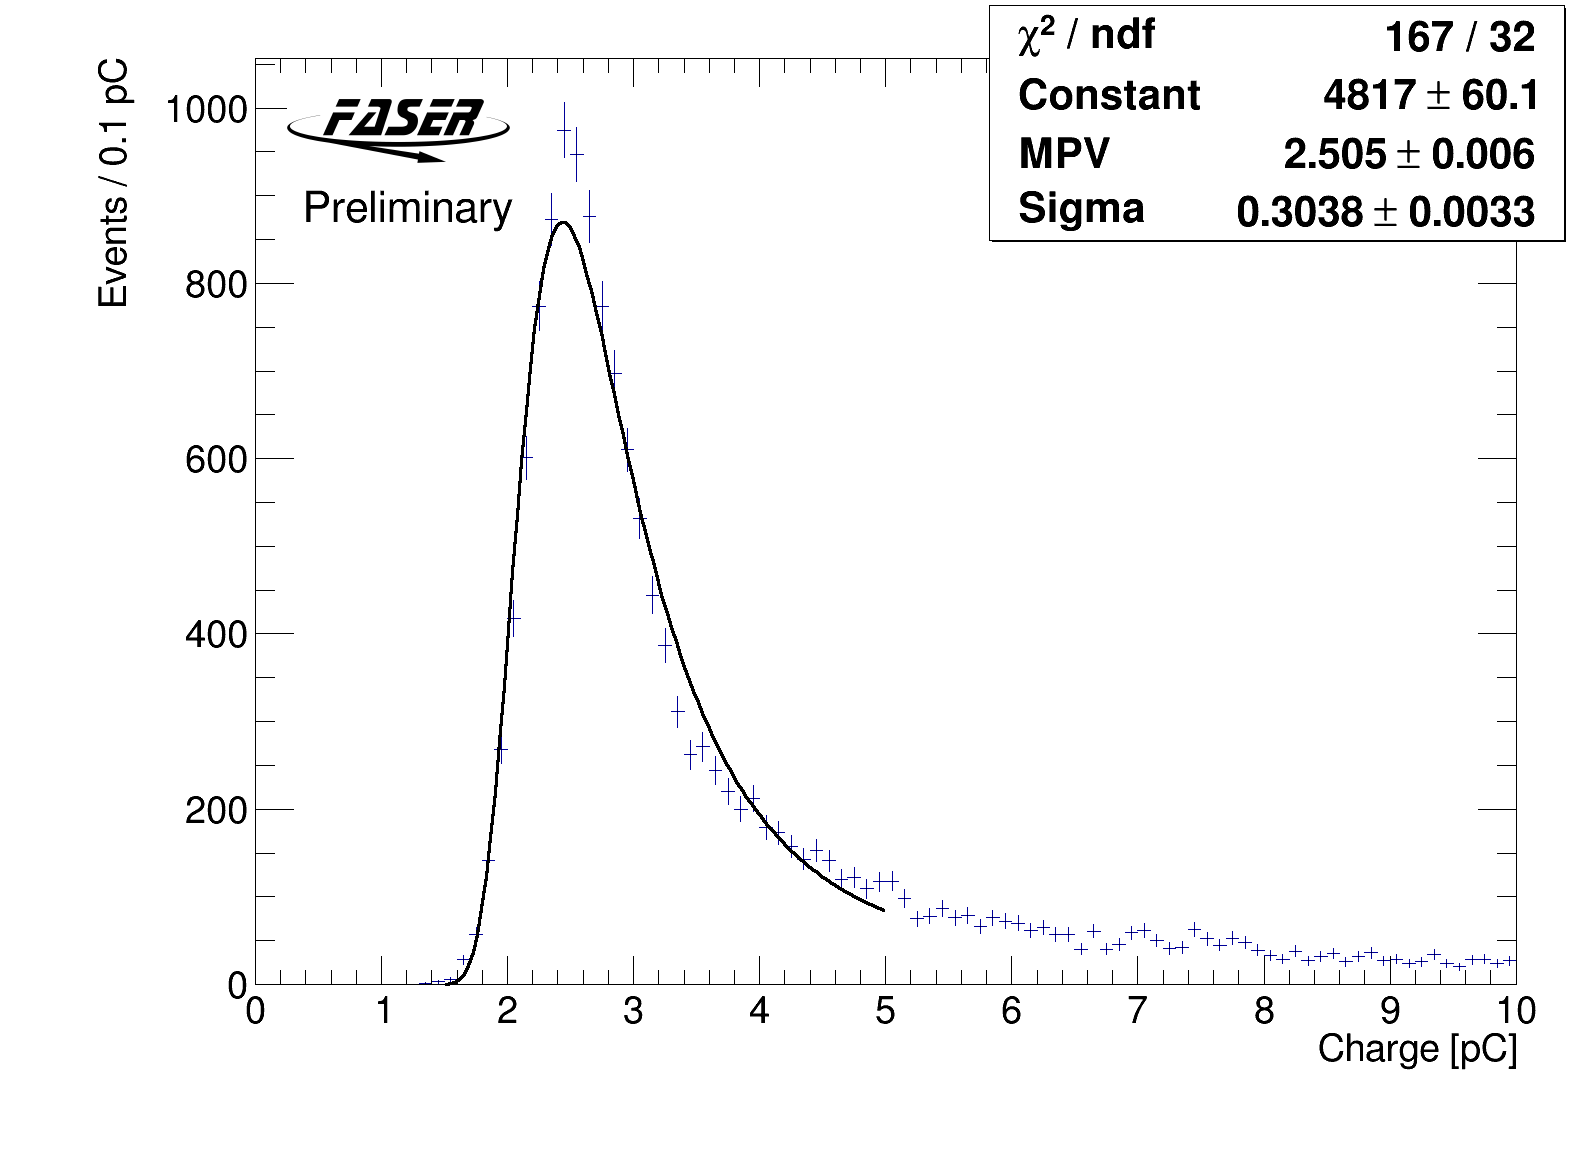
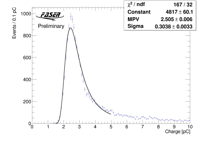
Fit of MIP signal in calorimeter
Charge distribution in low energy channel of top-right calorimeter module for
17,500 muons impacting 5 mm x 5 mm area of the module. Muons are selected as events
with a single well-reconstructed track with momentum above 20 GeV and projected to
impact the selected region. The charge distribution is fitted with a Landau function.
Note that resolution effects are not included leading to a suboptimal fit, but this does not
affect the fitted mean significantly.
|
 |
Scintillators |
DualCalo2024 |
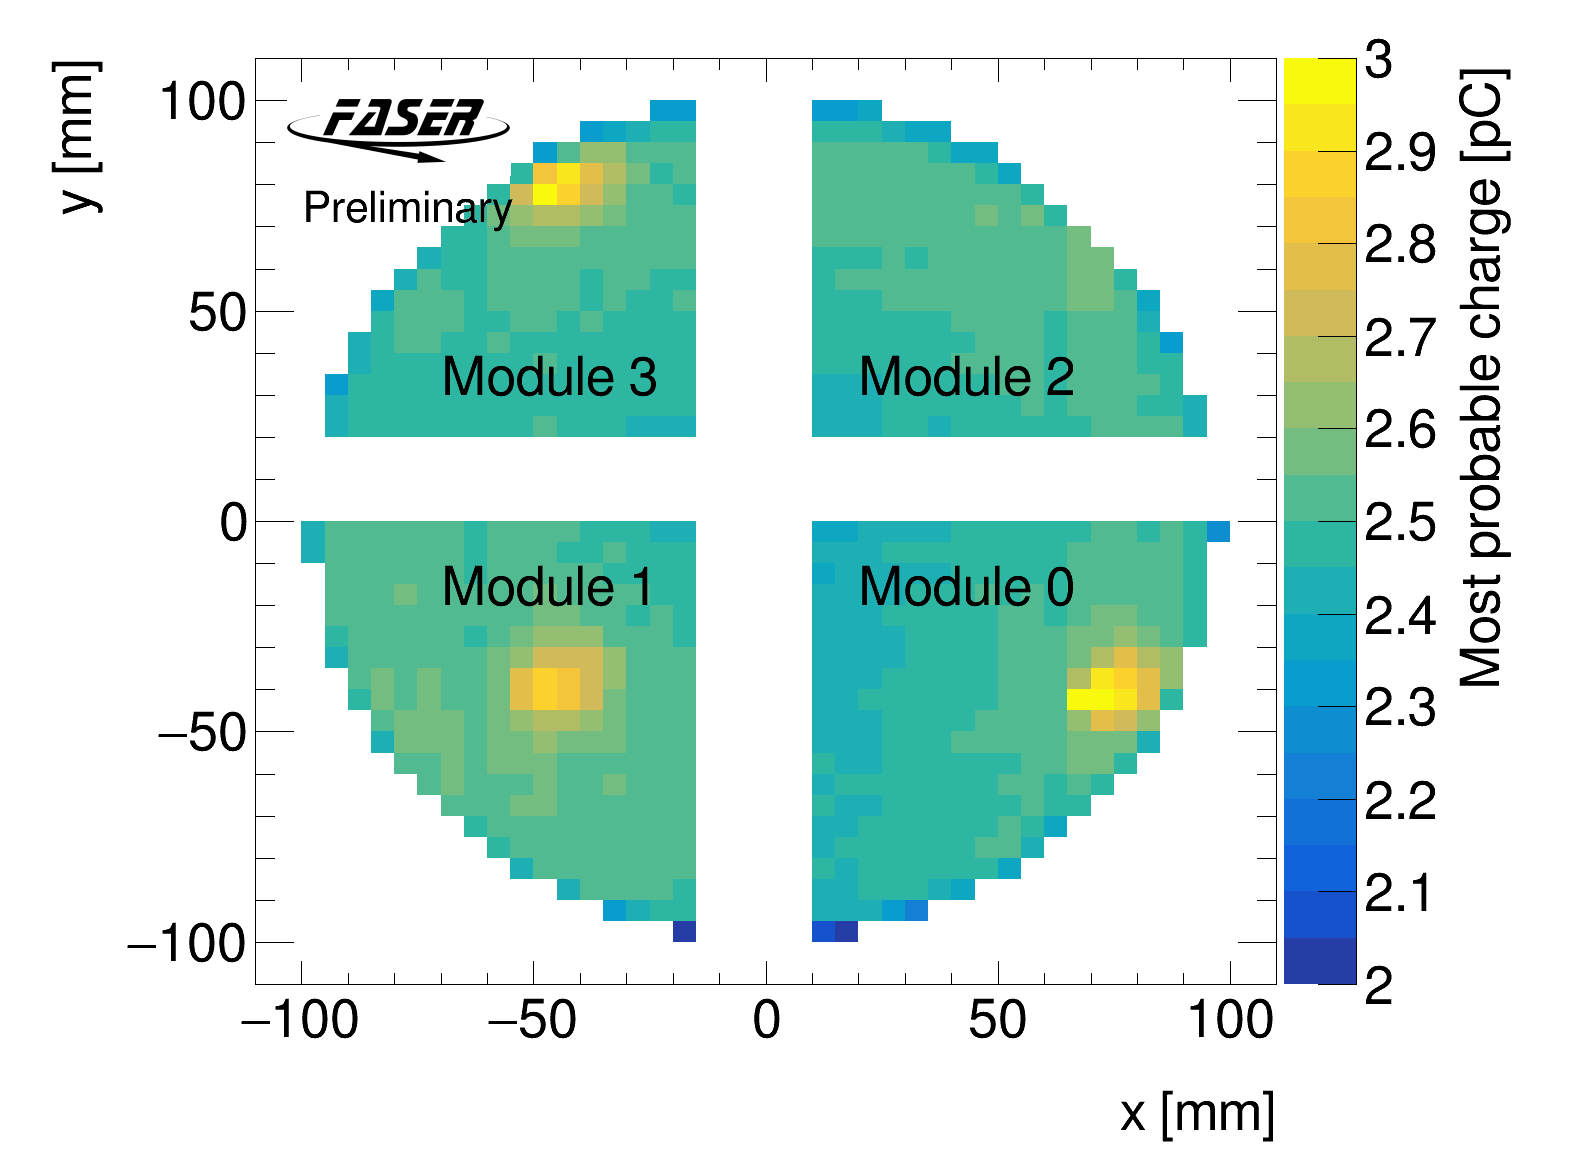
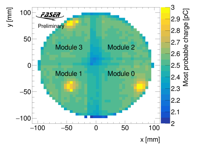
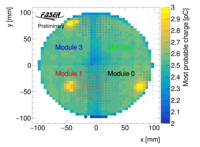
Most probable MIP charge vs position
Fitted most probable charge in low energy channel in 5 mm x 5 mm areas of each
calorimeter module for muons. Muons are selected as events with a single well-
reconstructed track with momentum above 20 GeV and a maximum radial position of
95 mm. The charge distribution in each area is fitted with a Landau function.
Regions with significant signal sharing between modules are excluded.
The high charge regions for x around-50 mm and x around 70 mm are due to the
muons impacting and generating Cherenkov light in the PMTs behind
the calorimeter module.
|
 |
Scintillators |
DualCalo2024 |
Most probable MIP charge vs position with PMT outline
Fitted most probable charge in low energy channel in 5 mm x 5 mm areas
of each calorimeter module for muons. Muons are selected as events
with a single well- reconstructed track with momentum above 20 GeV and
a maximum radial position of 95 mm. The charge distribution in each
area is fitted with a Landau function. Regions with significant signal
sharing between modules are excluded. The high charge regions for x around
-50 mm and x around 70 mm are due to the muons impacting and generating
Cherenkov light in the PMTs behind the calorimeter module. Nominal
position of the front of the PMTs are indicated by red circles.
|
 |
Scintillators |
DualCalo2024 |
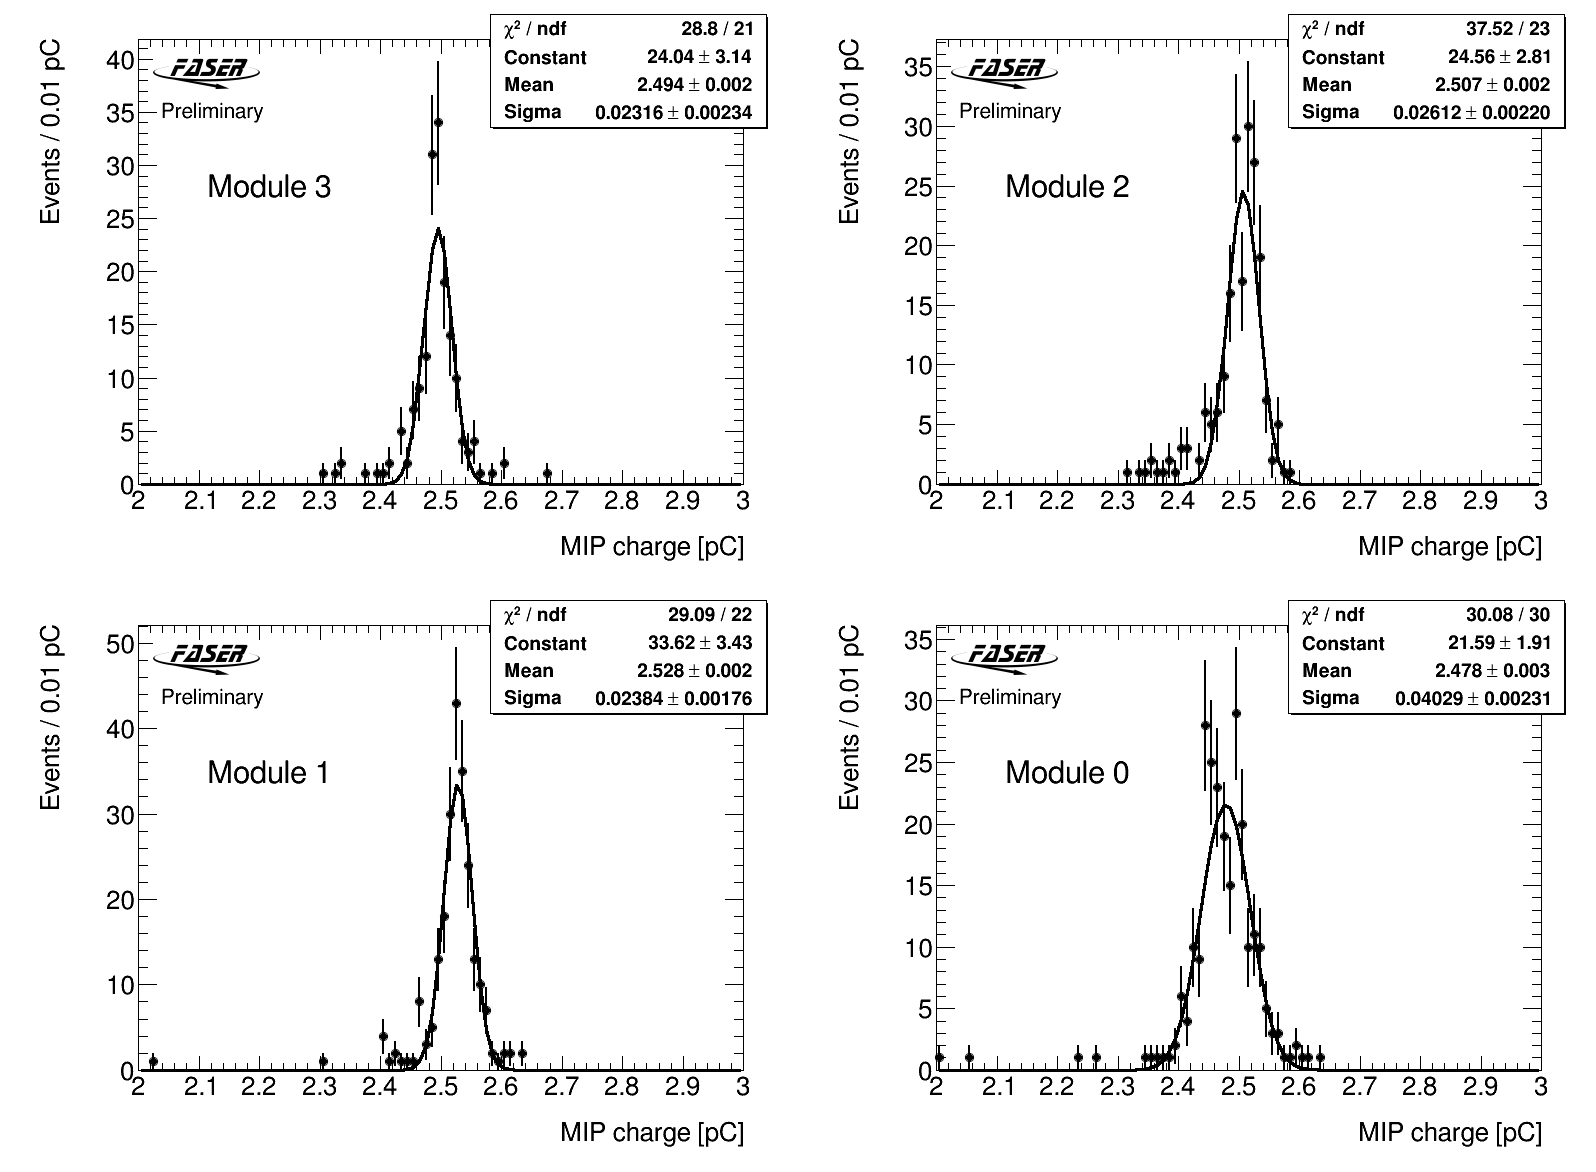
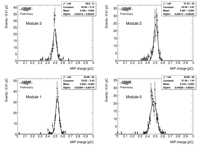
Most probable MIP charge fits
Most probable charge in the low energy channel in 5 mm x 5 mm areas of
each of the four calorimeter module for muons excluding regions where
muons hit the PMT. This shows a consistency between modules and a
spread of less than 2%. Muons are selected as events with a single
well-reconstructed track with momentum above 20 GeV and a maximum
radial position of 95 mm. The charge distribution in each area is
fitted with a Landau function and the shown distributions are fitted
with a Gaussian.
|
 |
Scintillators |
DualCalo2024 |
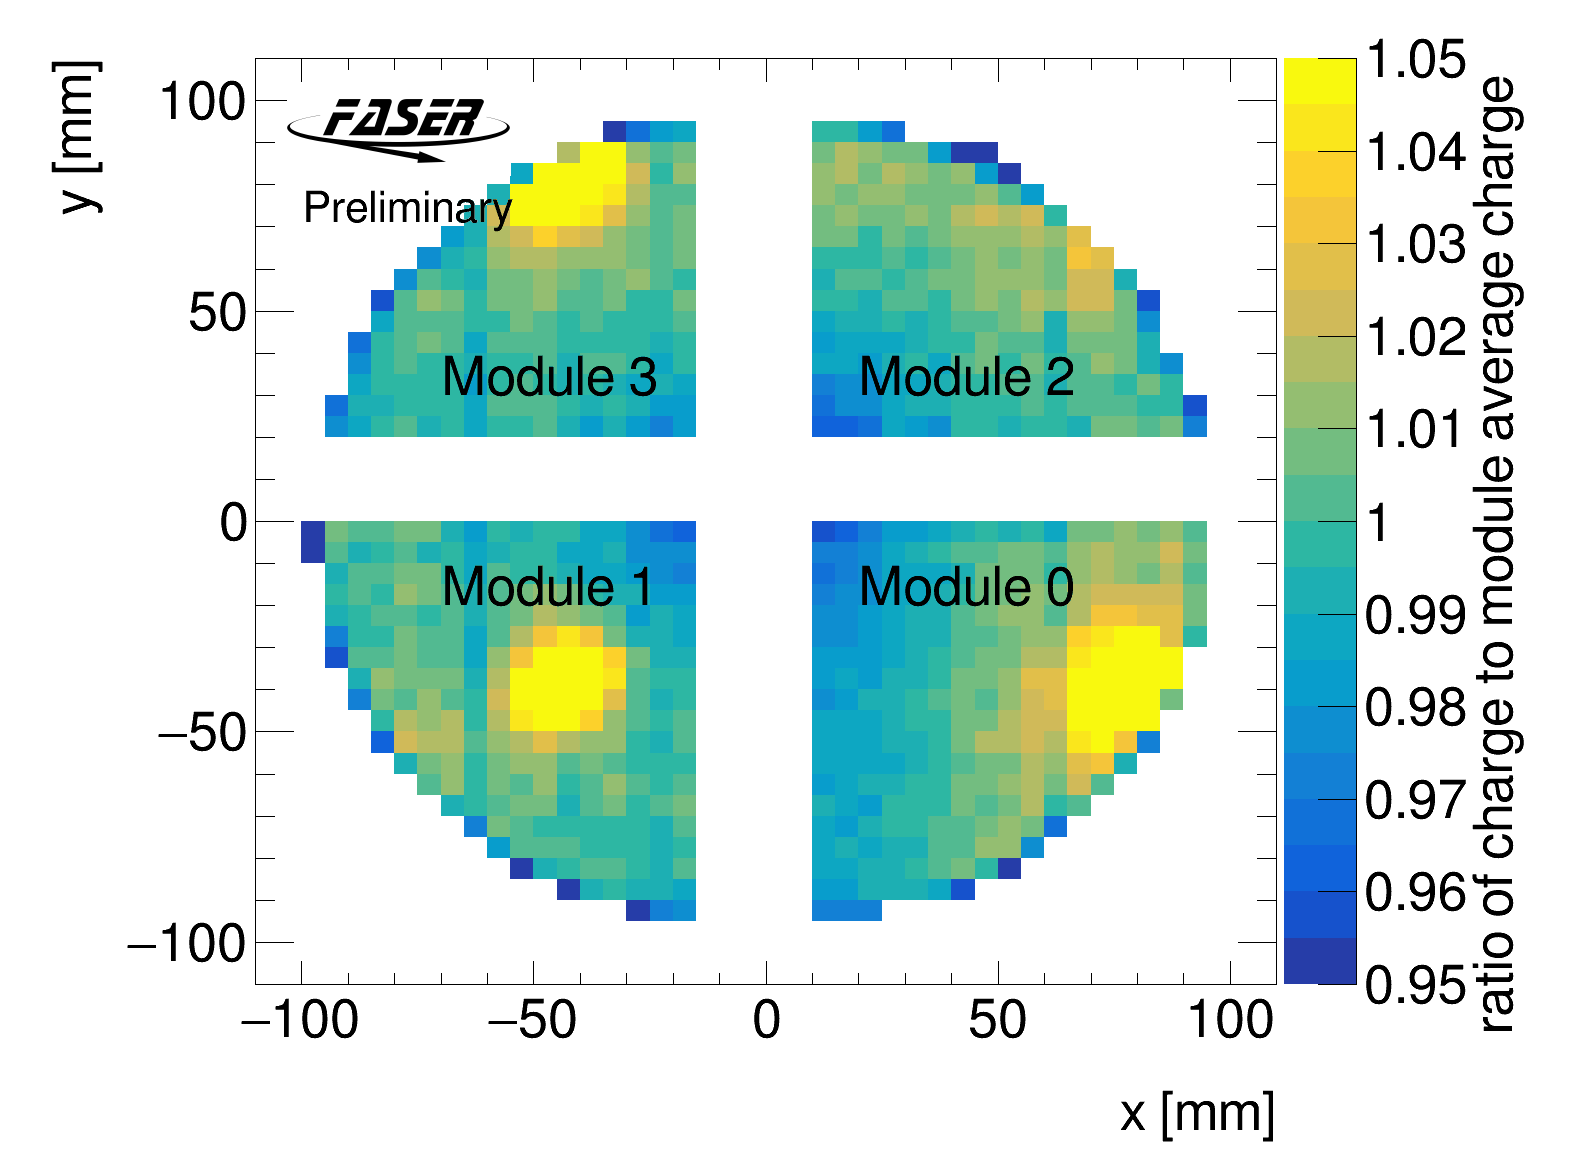
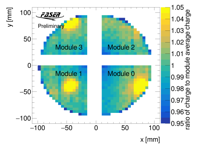
Most probable MIP charge vs position normalized to average
Fitted most probable charge in low energy channel in 5 mm x 5 mm areas
of each calorimeter module for muons normalized to average in each
module, excluding regions where PMTs are hit by muons. Muons are
selected as events with a single well- reconstructed track with
momentum above 20 GeV and a maximum radial position of 95 mm. The
charge distribution in each area is fitted with a Landau function.
The high charge regions for x around -50 mm and x around 70 mm are due
to the muons impacting and generating Cherenkov light in the fibers
and PMTs behind the calorimeter module.
|
 |
Scintillators |
DualCalo2024 |
Most probable MIP charge after summing calorimeter modules
Fitted most probable charge in low energy channel in 5 mm x 5 mm areas
the calorimeter for muons using the sum of the calibrated charge in
all four modules. Muons are selected as events with a single
well-reconstructed track with momentum above 20 GeV and a maximum
radial position of 95 mm. The charge distribution in each area is
fitted with a Landau function. The high charge regions for x around
-50 mm and x around 70 mm are due to the muons impacting and
generating Cherenkov light in the fibers and PMTs behind the
calorimeter module.
|
 |
Scintillators |
DualCalo2024 |
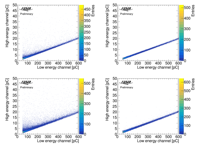
Charge correlation of high and low energy channels
Charge in high energy vs low energy channel of each calorimeter module
for muons passing through the module showing good correlation between
the two channels at the expected 1:30 ratio, though with some events
with excess charge particularly in module 1 and 3. This is due to
muons impacting and generating Cherenkov light in the fibers and PMTs
behind the calorimeter module. Muons are selected as events with a
single well- reconstructed track with momentum above 20 GeV and a
maximum radial position of 95mm.
|
 |
Scintillators |
DualCalo2024 |
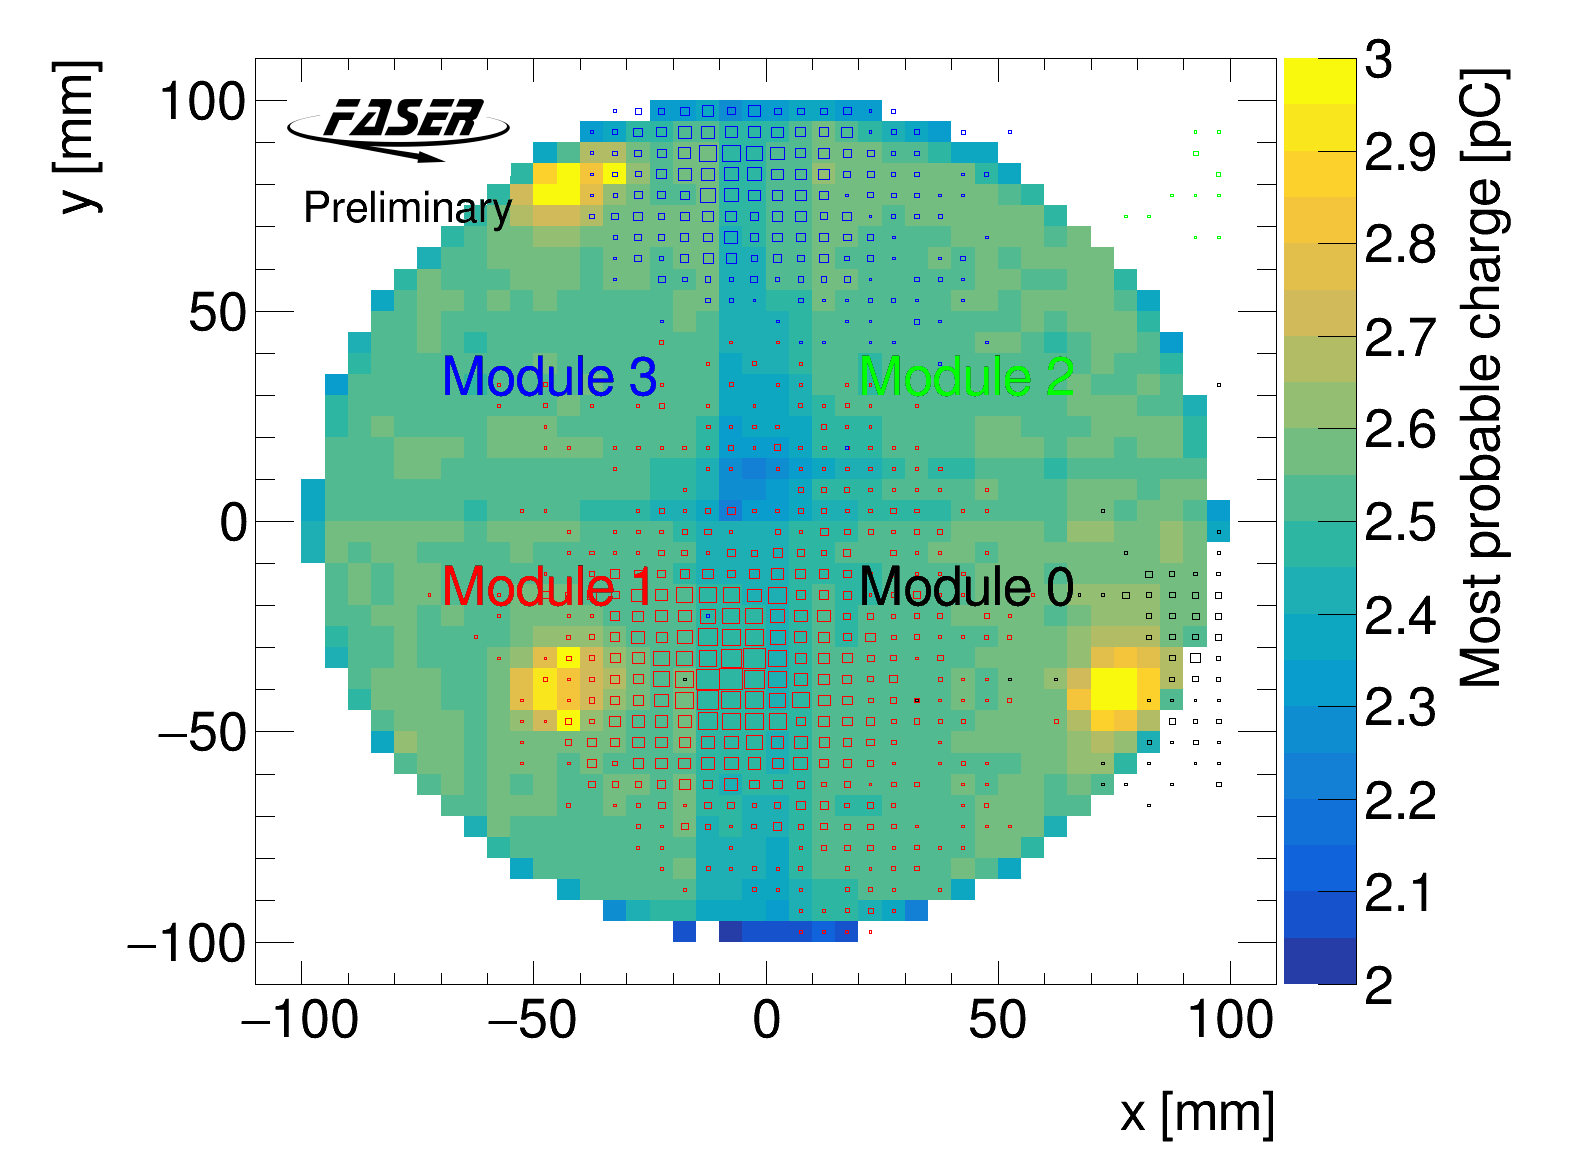
Track distribution of muons with larger than expected signal in high energy channel
Distribution of muons tracks with higher than expected high energy
channel charge compared to the low energy channel. The tracks are
projected onto the calorimeter surface and density is shown as open
boxes colored by module with the too large signal. Color shows most
probable MIP charge in this region of the calorimeter. Most of the
tracks coincide with the location of the high energy PMT indicating
the excess is due to the muons impacting the PMT and generating
Cherenkov light. Muons are selected as events with a single
well-reconstructed track with momentum above 20 GeV and a maximum
radial position of 95mm.
|
 |
Scintillators |
DualCalo2024 |
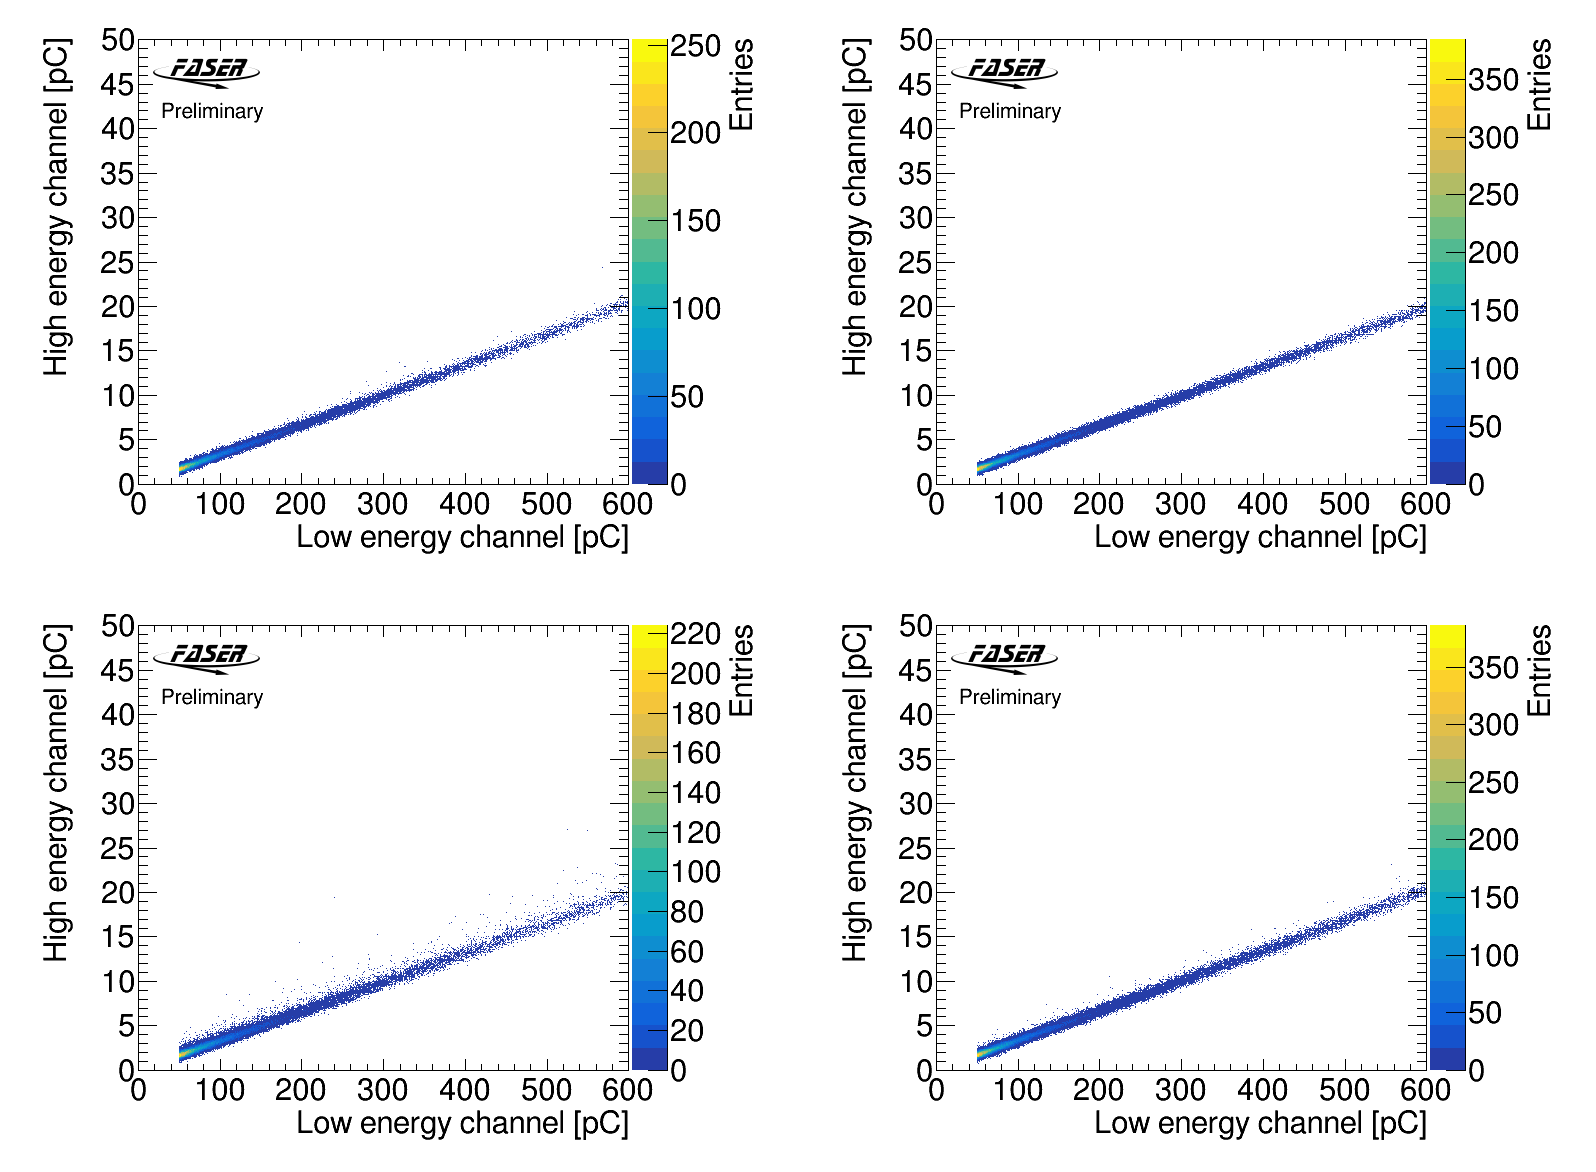
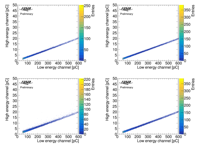
Charge correlation of high and low energy channels in good regions
Charge in high energy vs low energy channel of each calorimeter module
for muons passing through the module in regions away from the PMTs and
fiber bundle showing very good correlation between the two channels at
the expected 1:30 ratio. Muons are selected as events with a single
well-reconstructed track with momentum above 20 GeV and a maximum
radial position of 95mm.
|
 |
Scintillators |
DualCalo2024 |
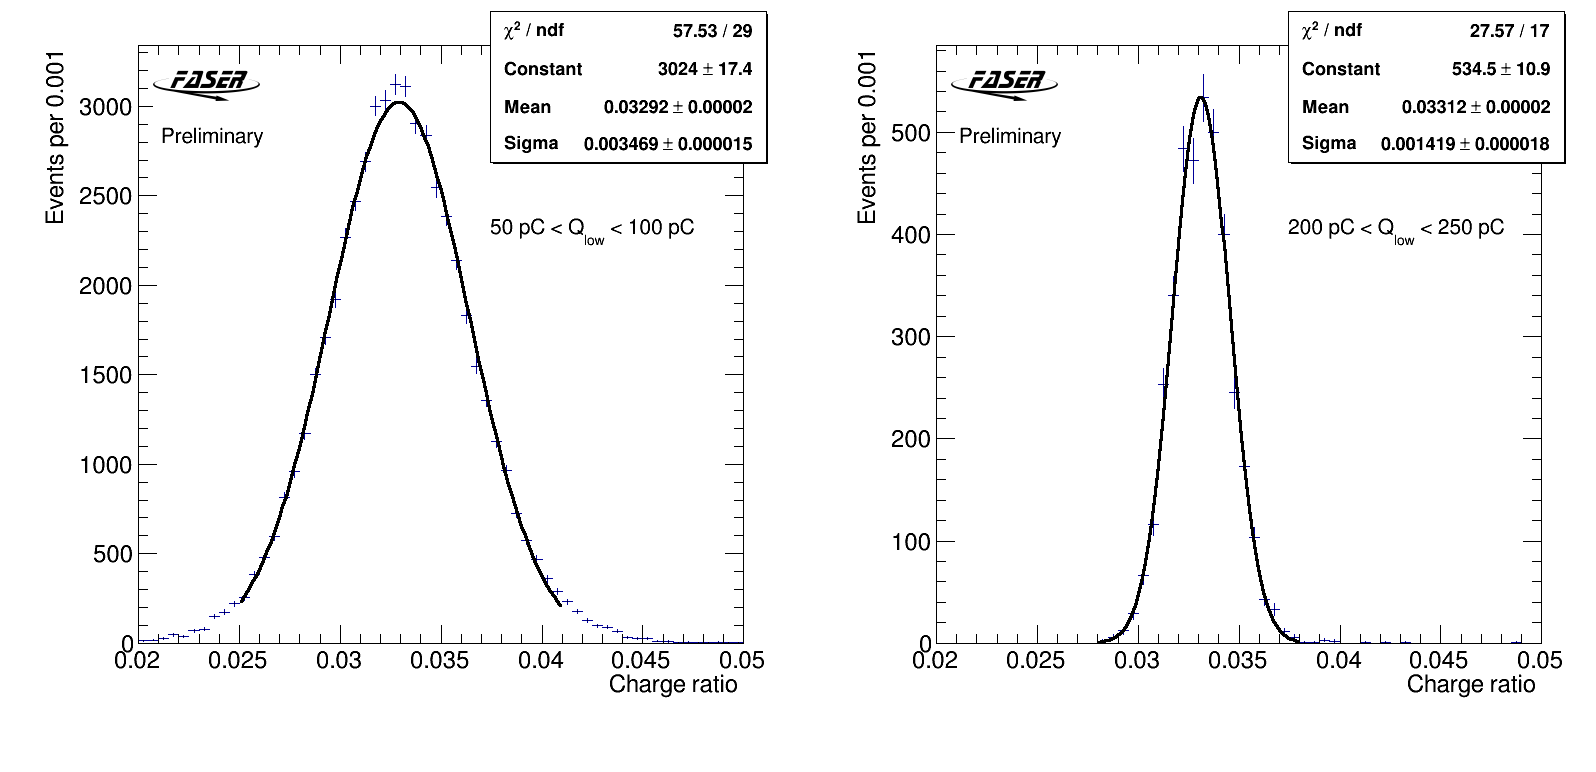
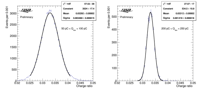
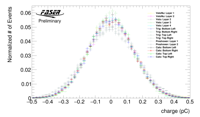
Example ratios of low and high energy channels
Charge in high energy over low energy channel in module 0 of the
calorimeter for radiating muons in two bins of low energy channel
charge. Both distributions are fitted with a single Gaussian.
|
 |
Scintillators |
DualCalo2024 |
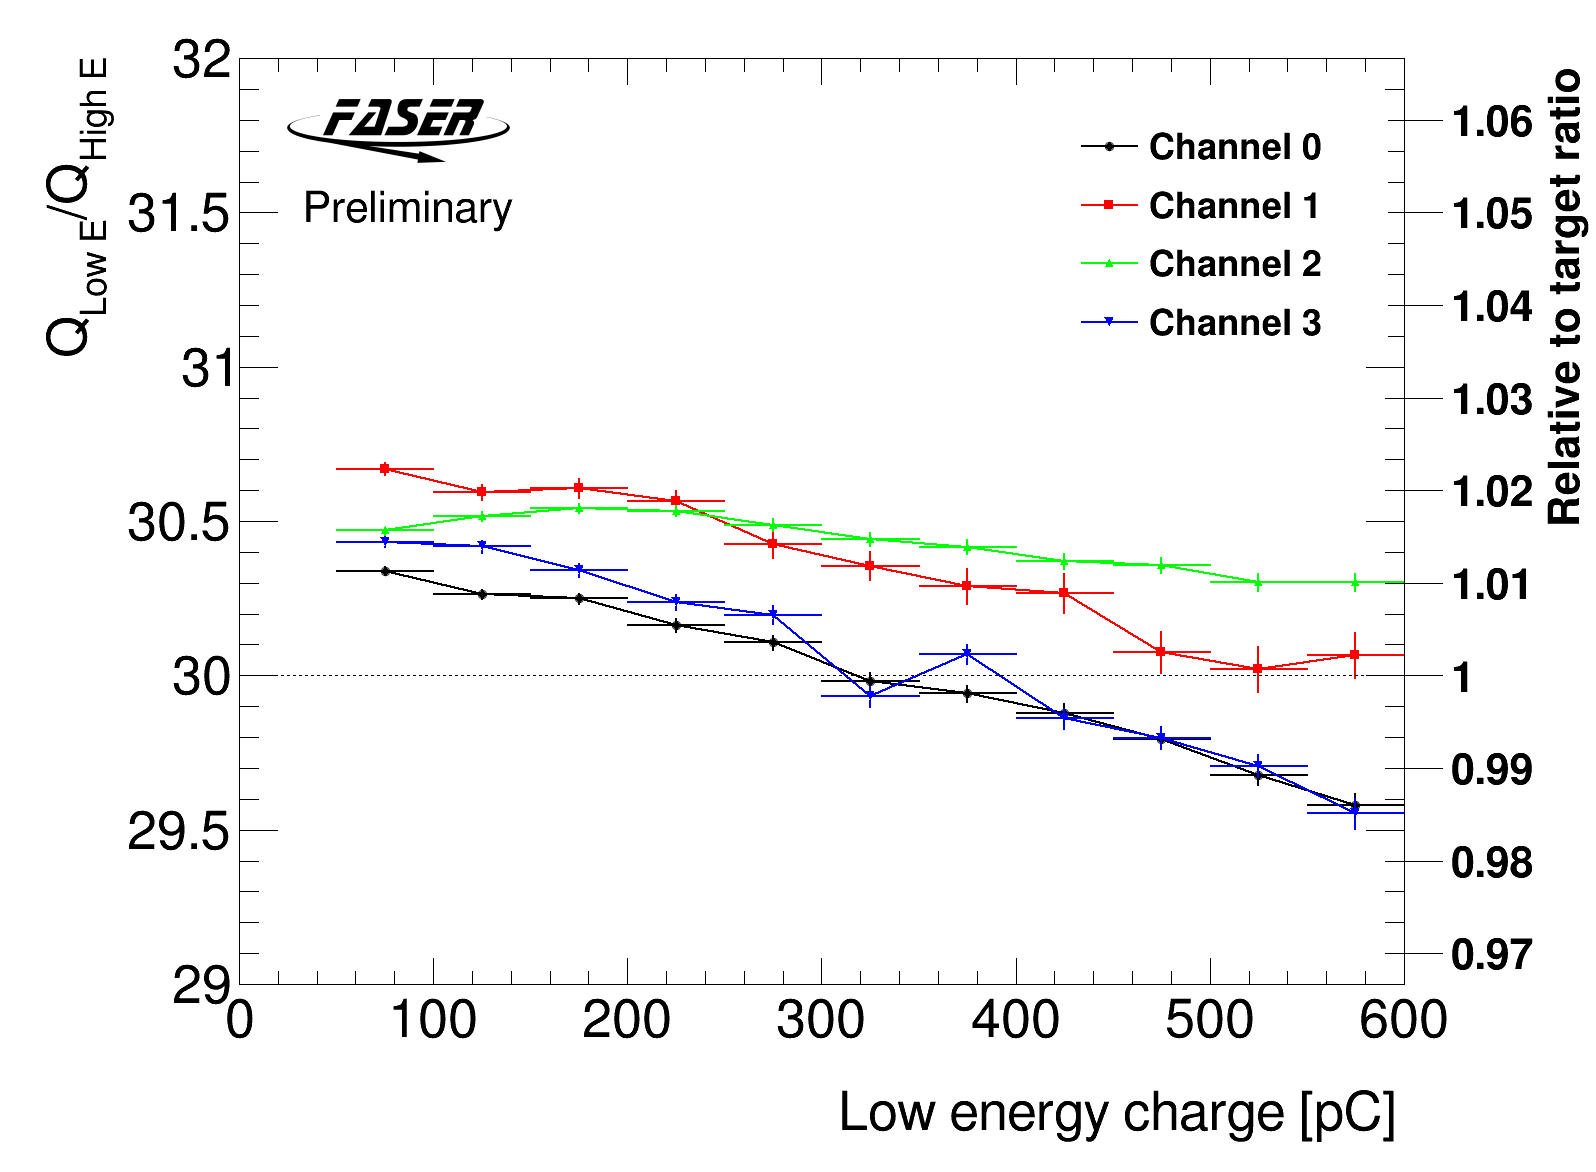
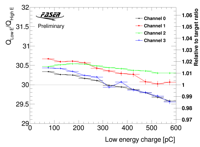
Ratio of low and high energy channels vs charge
Fitted charge ratio in low energy over high energy channels in the
four calorimeter modules as a function of low energy charge, showing a
2% non-linearity in calorimeter response due to the low HV operating
point of the low energy PMT. The dashed line indicates the targeted
ratio.
|
 |
Scintillators |
DualCalo2024 |
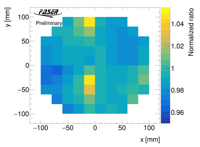
Ratio of low and high energy channels vs position
Fitted charge ratio in high energy over low energy channels (scaled by
the target ratio of 30) in 20mm x 20mm regions of the calorimeter for
muons with a low energy charge deposit between 100 and 200 pC,
corresponding to about 13-26 GeV of energy deposit. The high ratio
regions for x in [-20:0] mm are due to the muons impacting and
generating Cherenkov light in the fibers and PMTs behind the
calorimeter module. Muons are selected as events with a single
well-reconstructed track with momentum above 20 GeV and a maximum
radial position of 95mm.
|
 |
Scintillators |
FirstData |
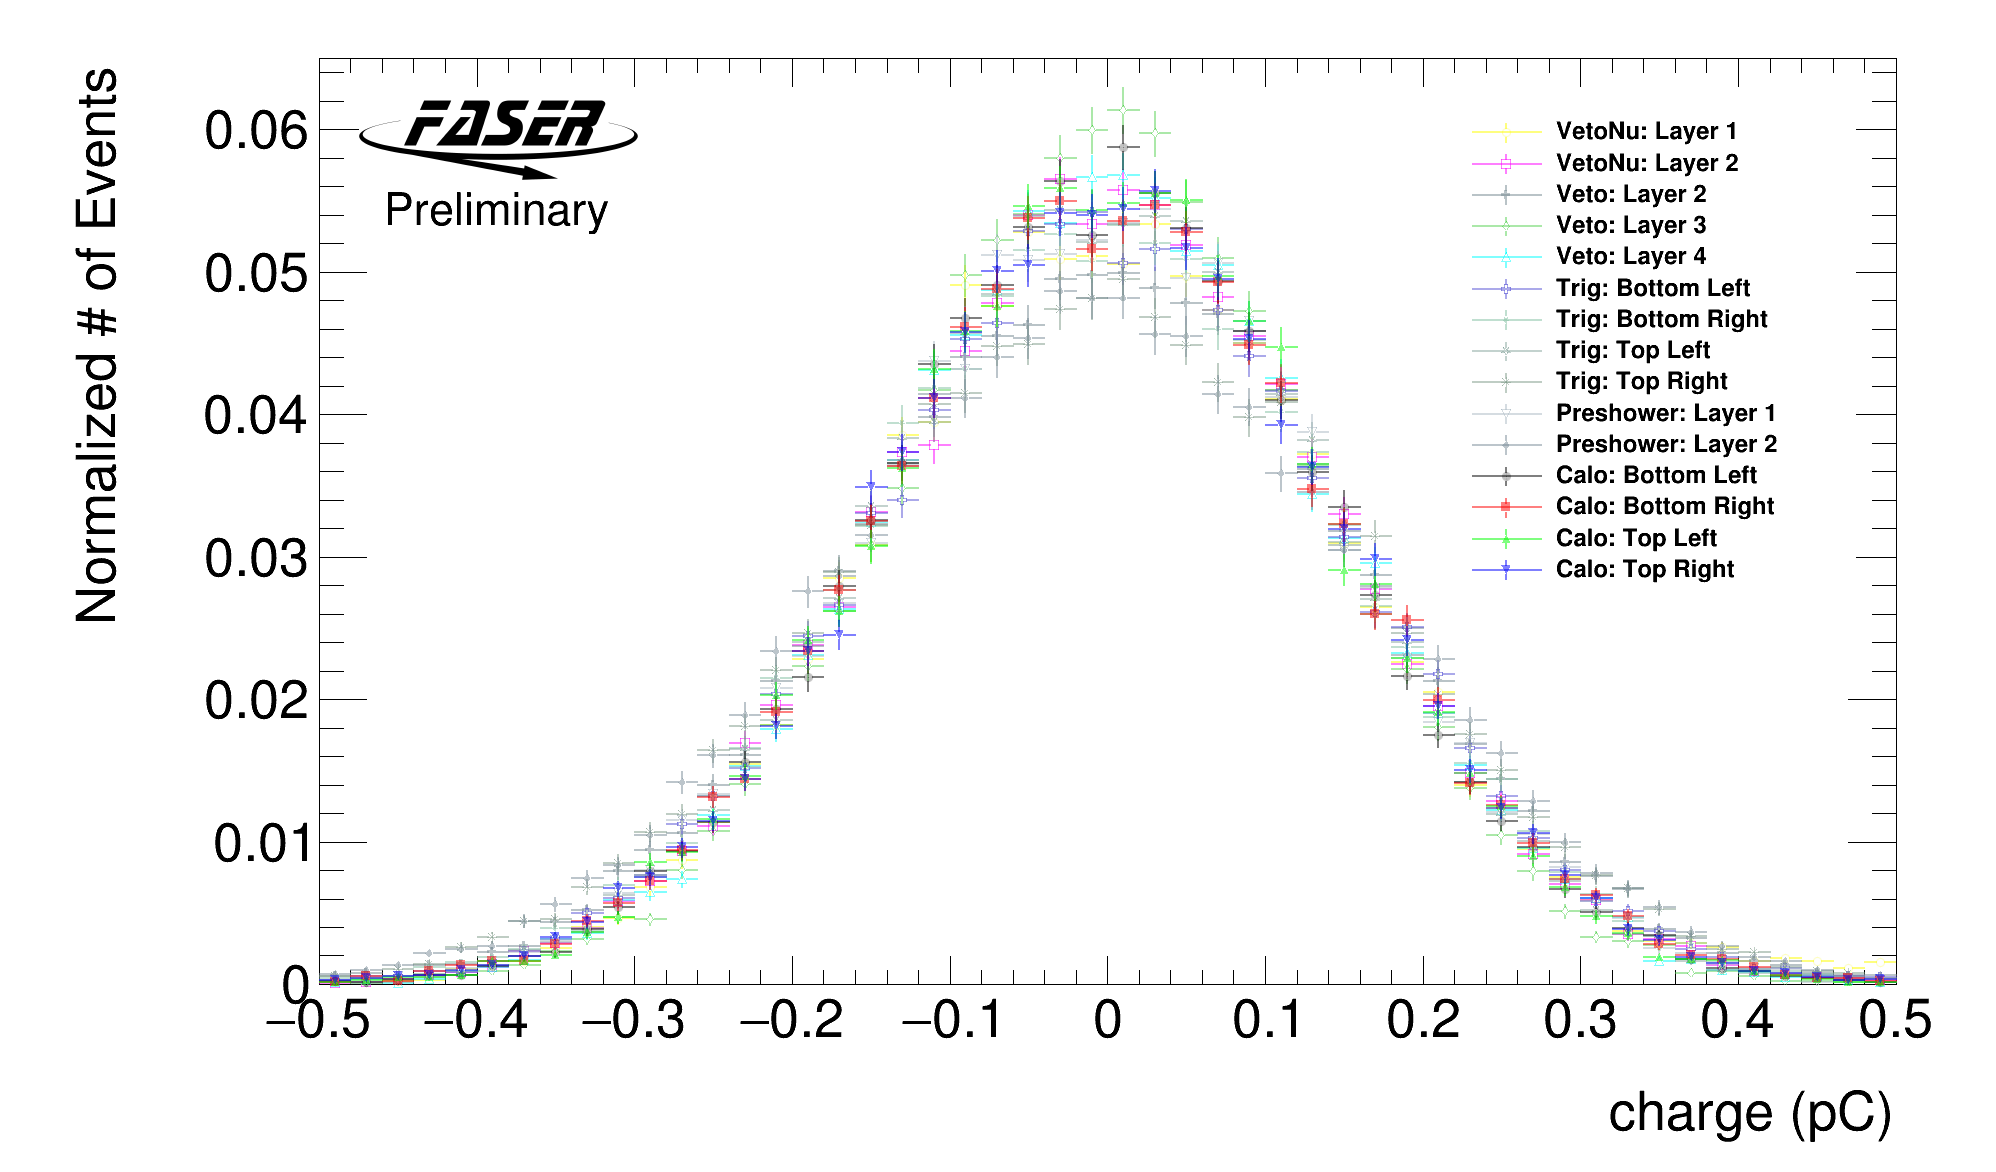
Noise distributions for all scintillator and calo channels
The pedestal subtracted charge distributions of randomly triggered events are shown for all scintillators and calorimeter modules. The charge is derived from the integration of the waveform over the standard 120 ns reconstruction window. Normalization of the distributions are done by dividing by the total number of events. The plot shows that the noise levels are similar across all scintillators and calorimeter channels, regardless of different PMT types and HV settings. Dominated by the digitizer noise, the total noise of each sub detector falls within the range of 0.15 ± 0.02 pC.
|
 |
Scintillators |
FirstData |
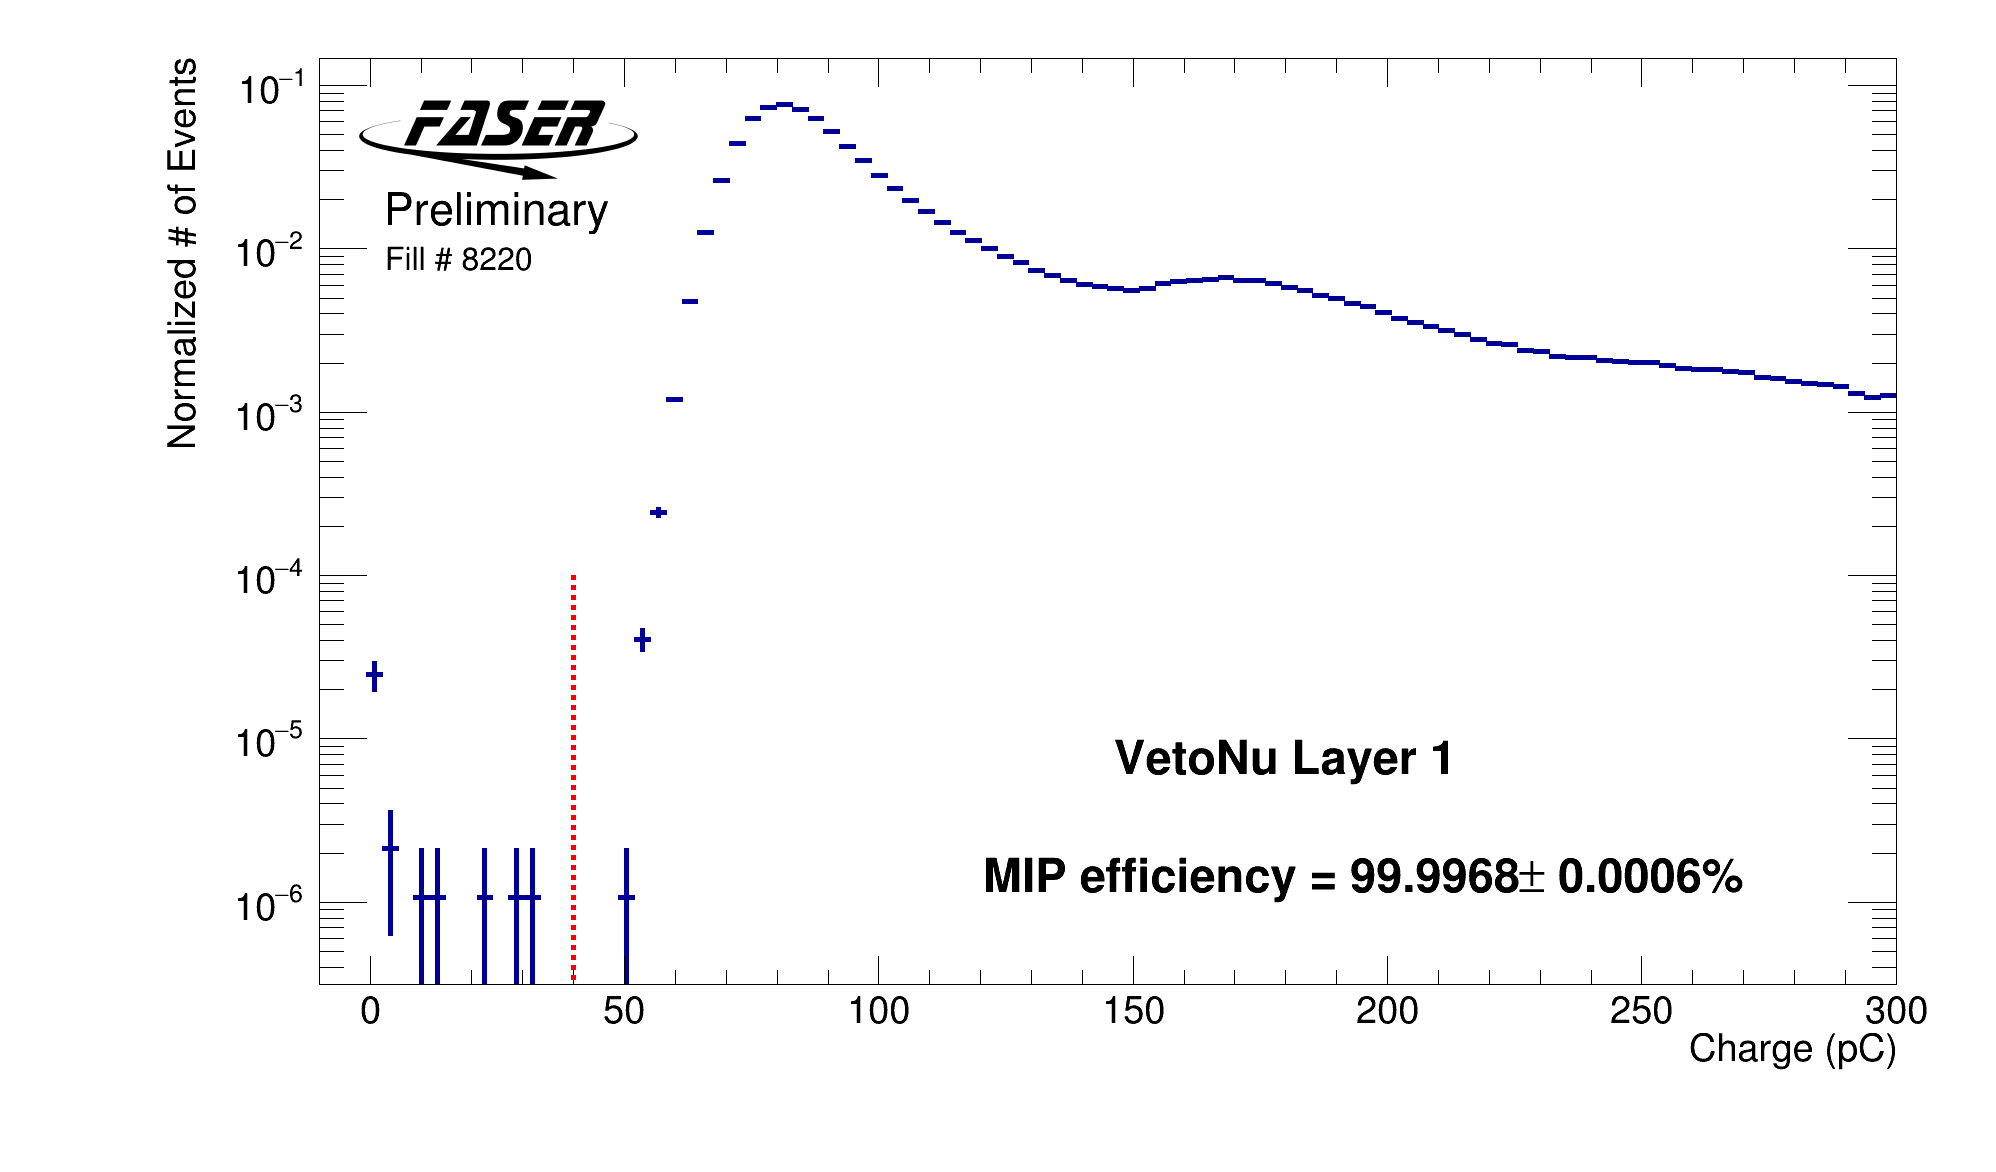
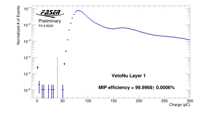
VetoNu layer 1 charge distribution and MIP detection efficiency
The pedestal subtracted charge distribution of VetoNu Layer 1 is shown. The distribution is normalized by dividing by the total number of events. Here, we only use events that had a single track going through all FASER tracking stations and was within the magnet aperture (r < 90mm) when extrapolated to VetoNu Layer 1. This plot uses data from LHC fill 8220, corresponding to an integrated luminosity of 463 pb-1. Using a 40 pC threshold (indicated by the dotted red line), we measure a MIP detection efficiency of 99.9968(6)%. The other VetoNu layer shows a similar charge distribution and MIP detection efficiency.
|
 |
Scintillators |
FirstData |
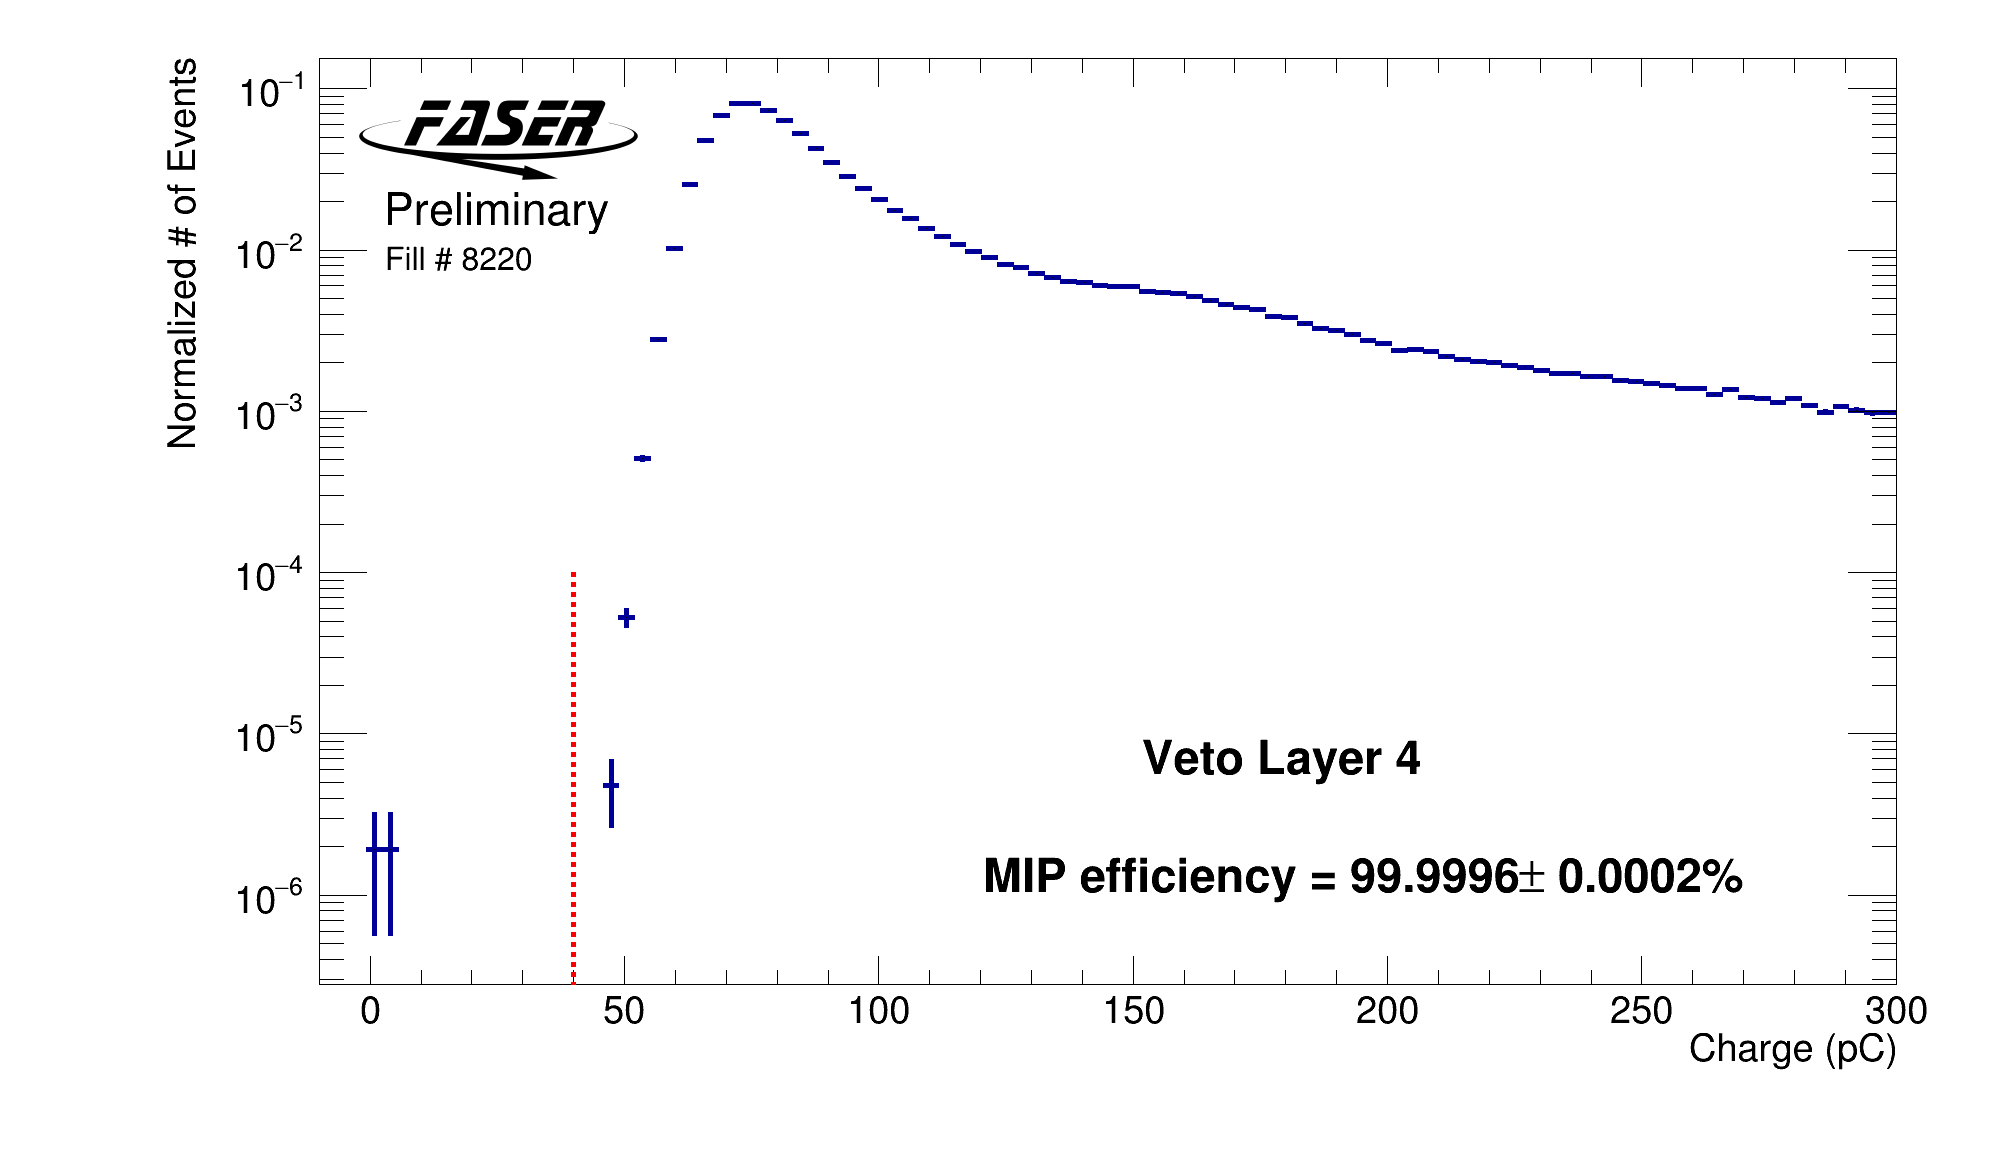
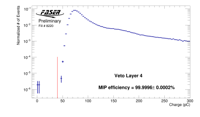
Veto layer 4 charge distribution and MIP detection efficiency
The pedestal subtracted charge distribution of Veto Layer 4 is shown. The distribution is normalized by dividing by the total number of events. Here, we only use events that had a single track going through all FASER tracking stations and was within the magnet aperture (r < 90mm) when extrapolated to Veto Layer 4. This plot uses data from LHC fill 8220, corresponding to an integrated luminosity of 463 pb-1. Using a 40 pC threshold (indicated by the dotted red line), we measure a MIP detection efficiency of 99.9996(2)%. The other Veto layers show similar charge distributions and MIP detection efficiencies.
|
 |
Scintillators |
FirstData |
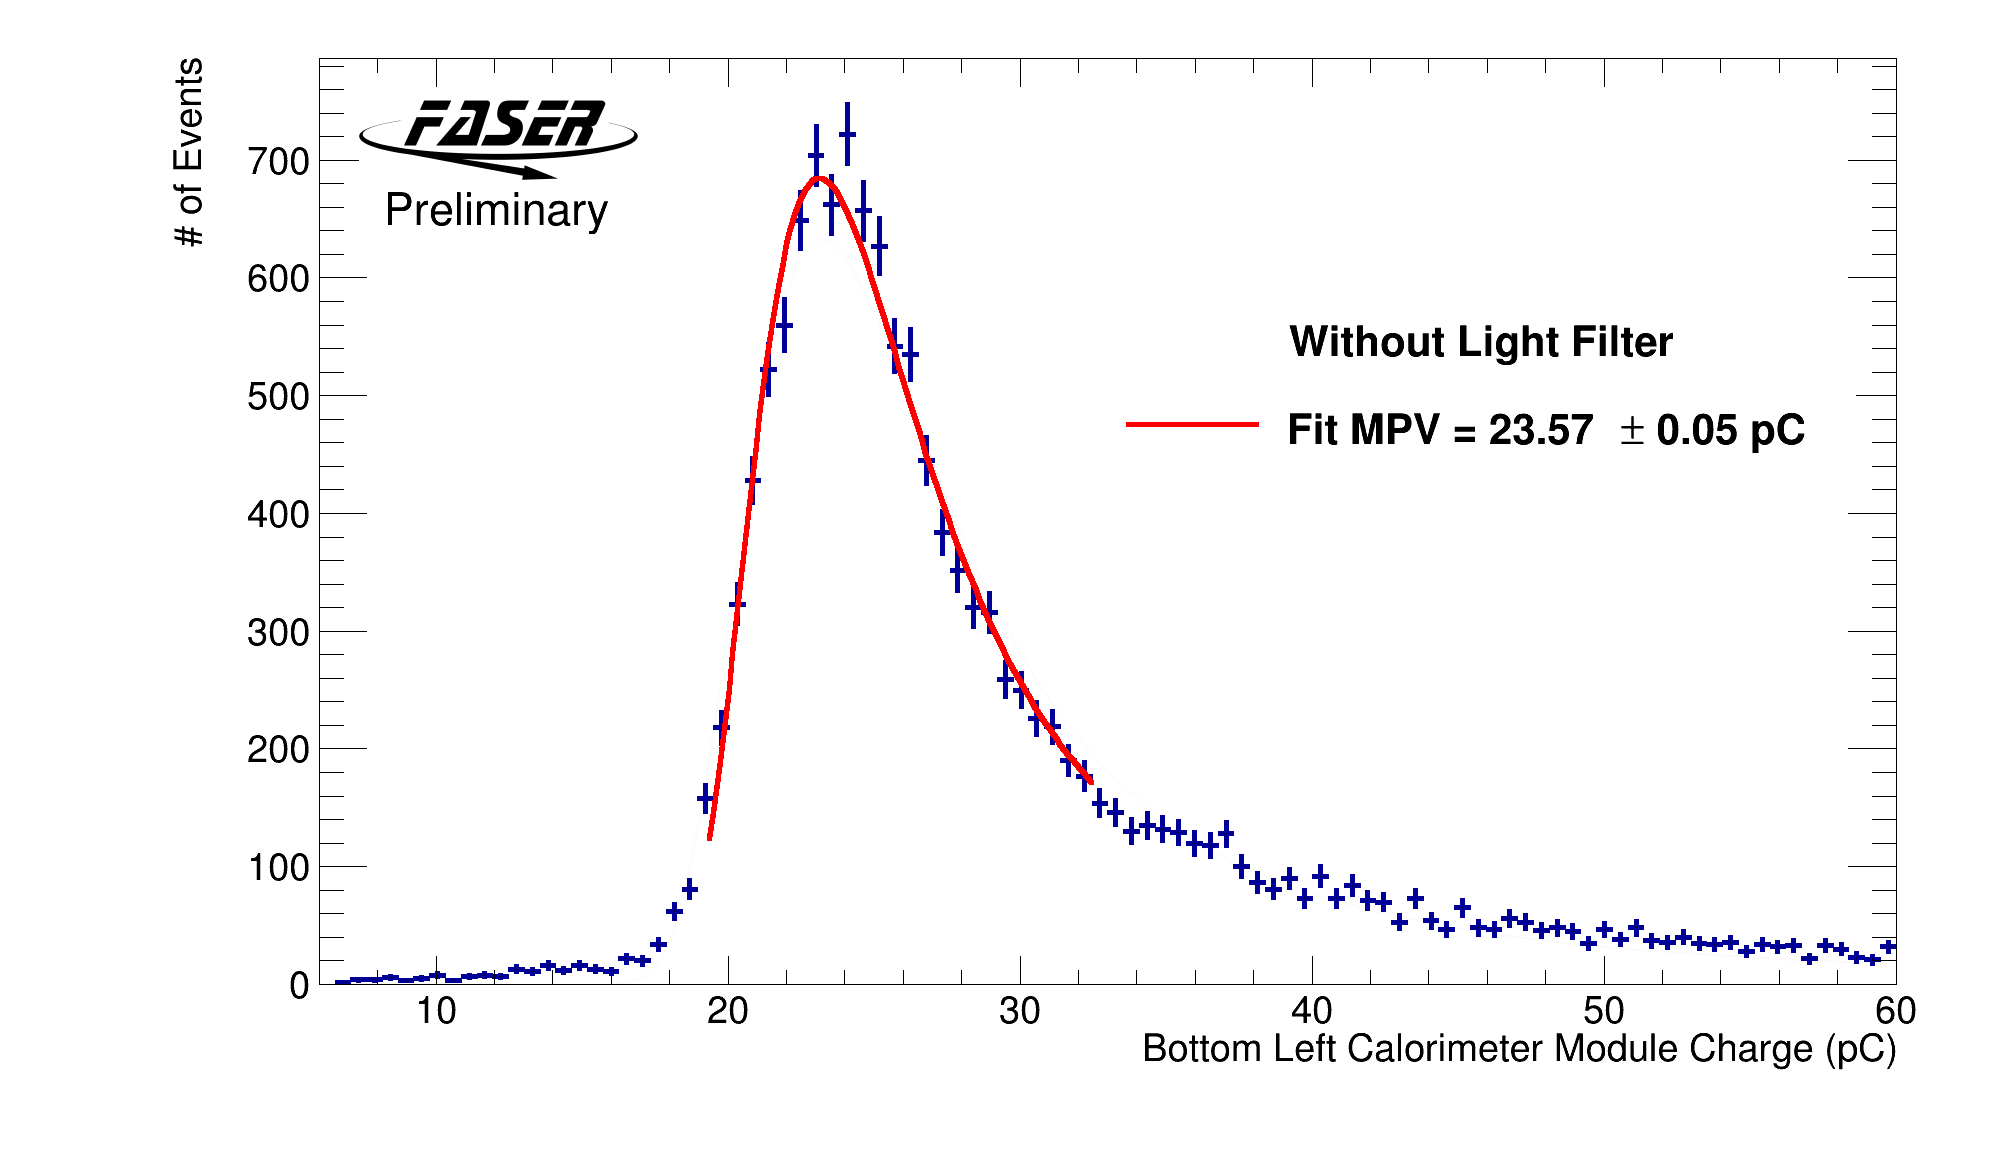
Calorimeter MIP charge distribution at high gain and without light filter
The pedestal subtracted charge distribution of the bottom left calorimeter module is shown for when the PMT is at high gain and no light filter is in place. Here, we are only using events that had a single track with an extrapolated position within the calorimeter module. This plot uses data from LHC fills 7960, 7969, and 7978, corresponding to an integrated luminosity of 82 pb-1. The fit is a Landau convoluted with a gaussian whose width is equal to that of the charge distribution from random events (noise rms = 0.15 pC).
|
 |
Scintillators |
FirstData |
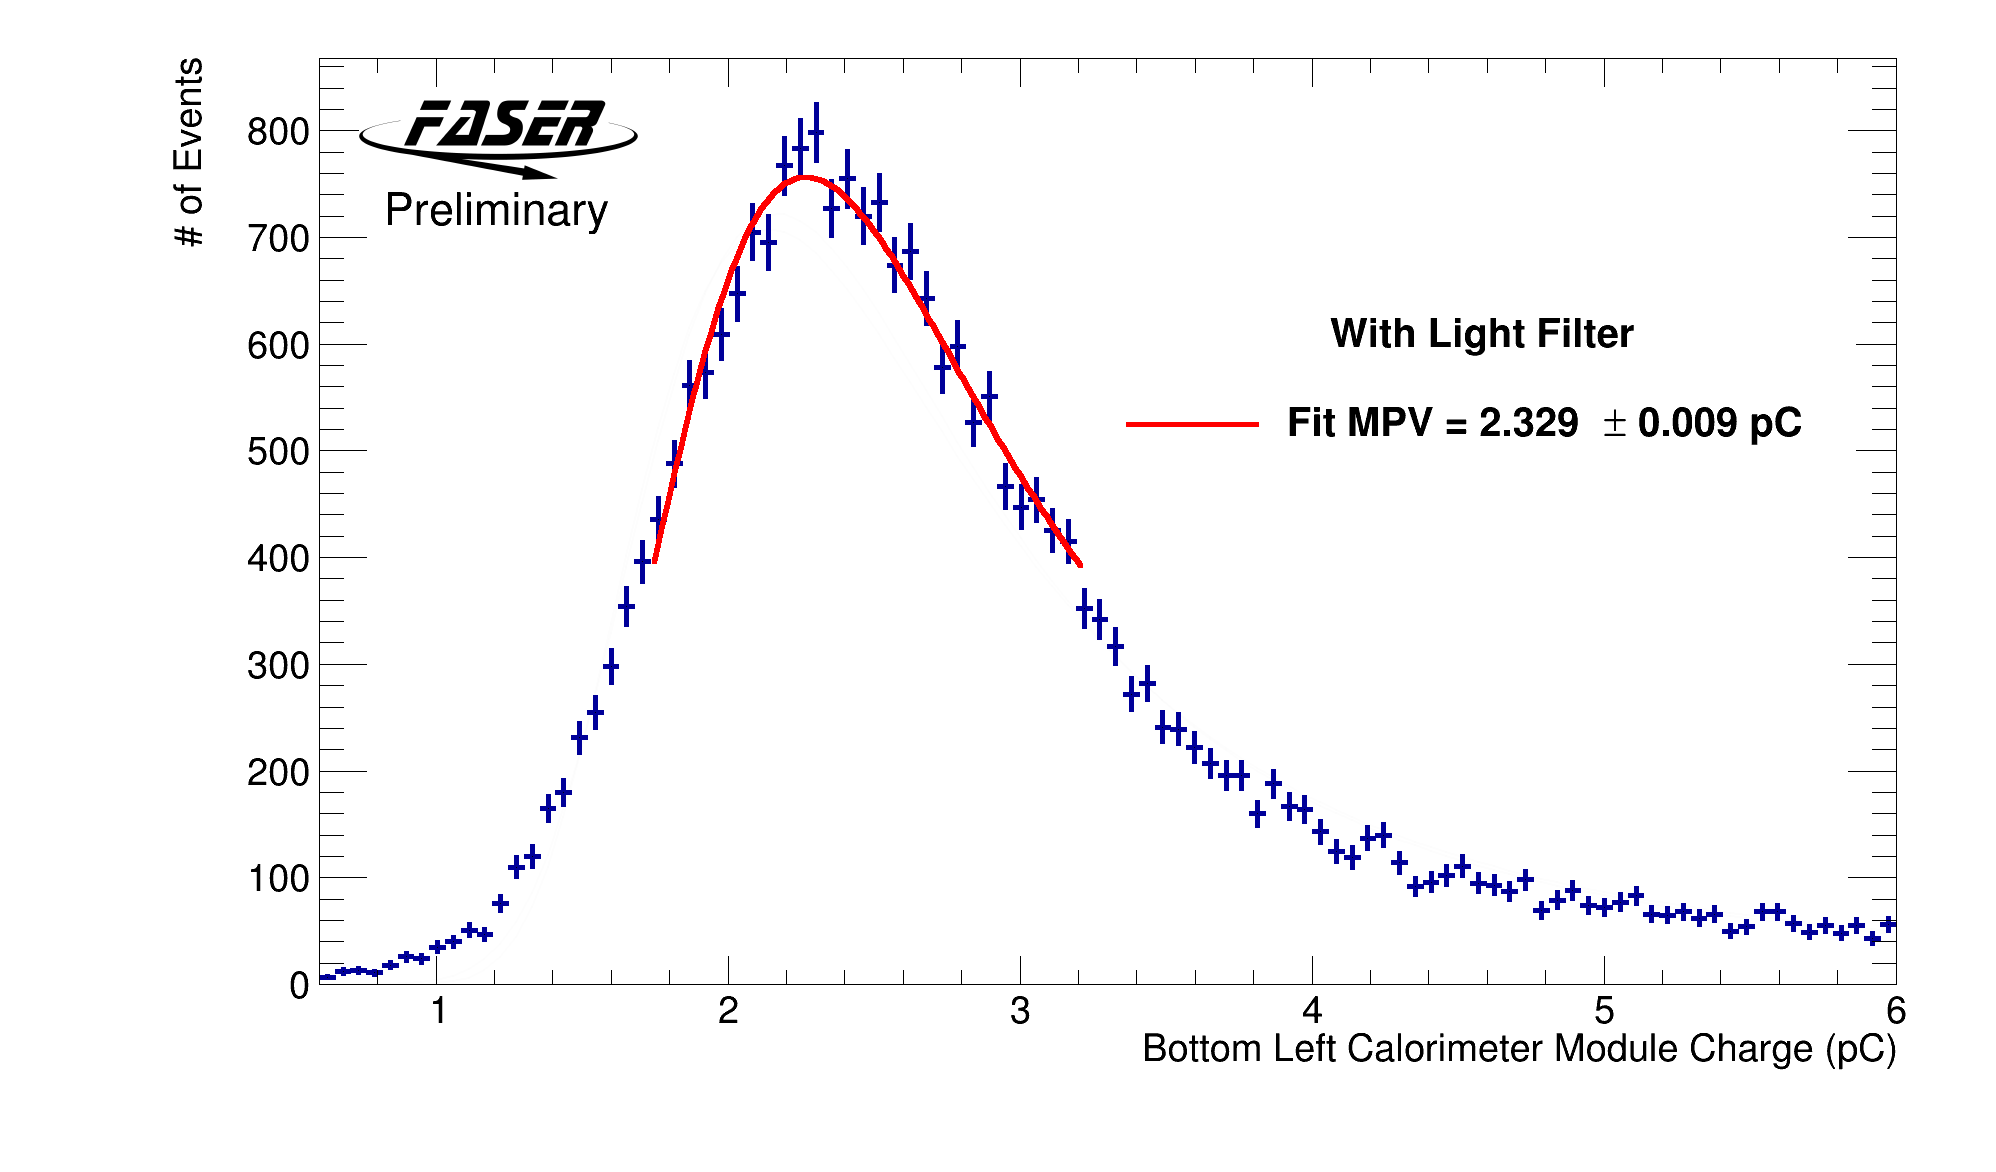
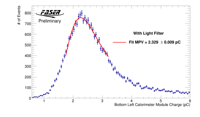
Calorimeter MIP charge distribution at high gain and with light filter
The pedestal subtracted charge distribution of the bottom left calorimeter module is shown for when the PMT is at high gain and the light filter is installed. Here, we are only using events that had a single track with an extrapolated position within the calorimeter module. This plot uses data from LHC fills 8212 and 8214, corresponding to an integrated luminosity of 104 pb-1. The fit is a Landau convoluted with a gaussian whose width is equal to that of the charge distribution from random events (noise rms = 0.15 pC).
|
 |
Scintillators |
FirstData |
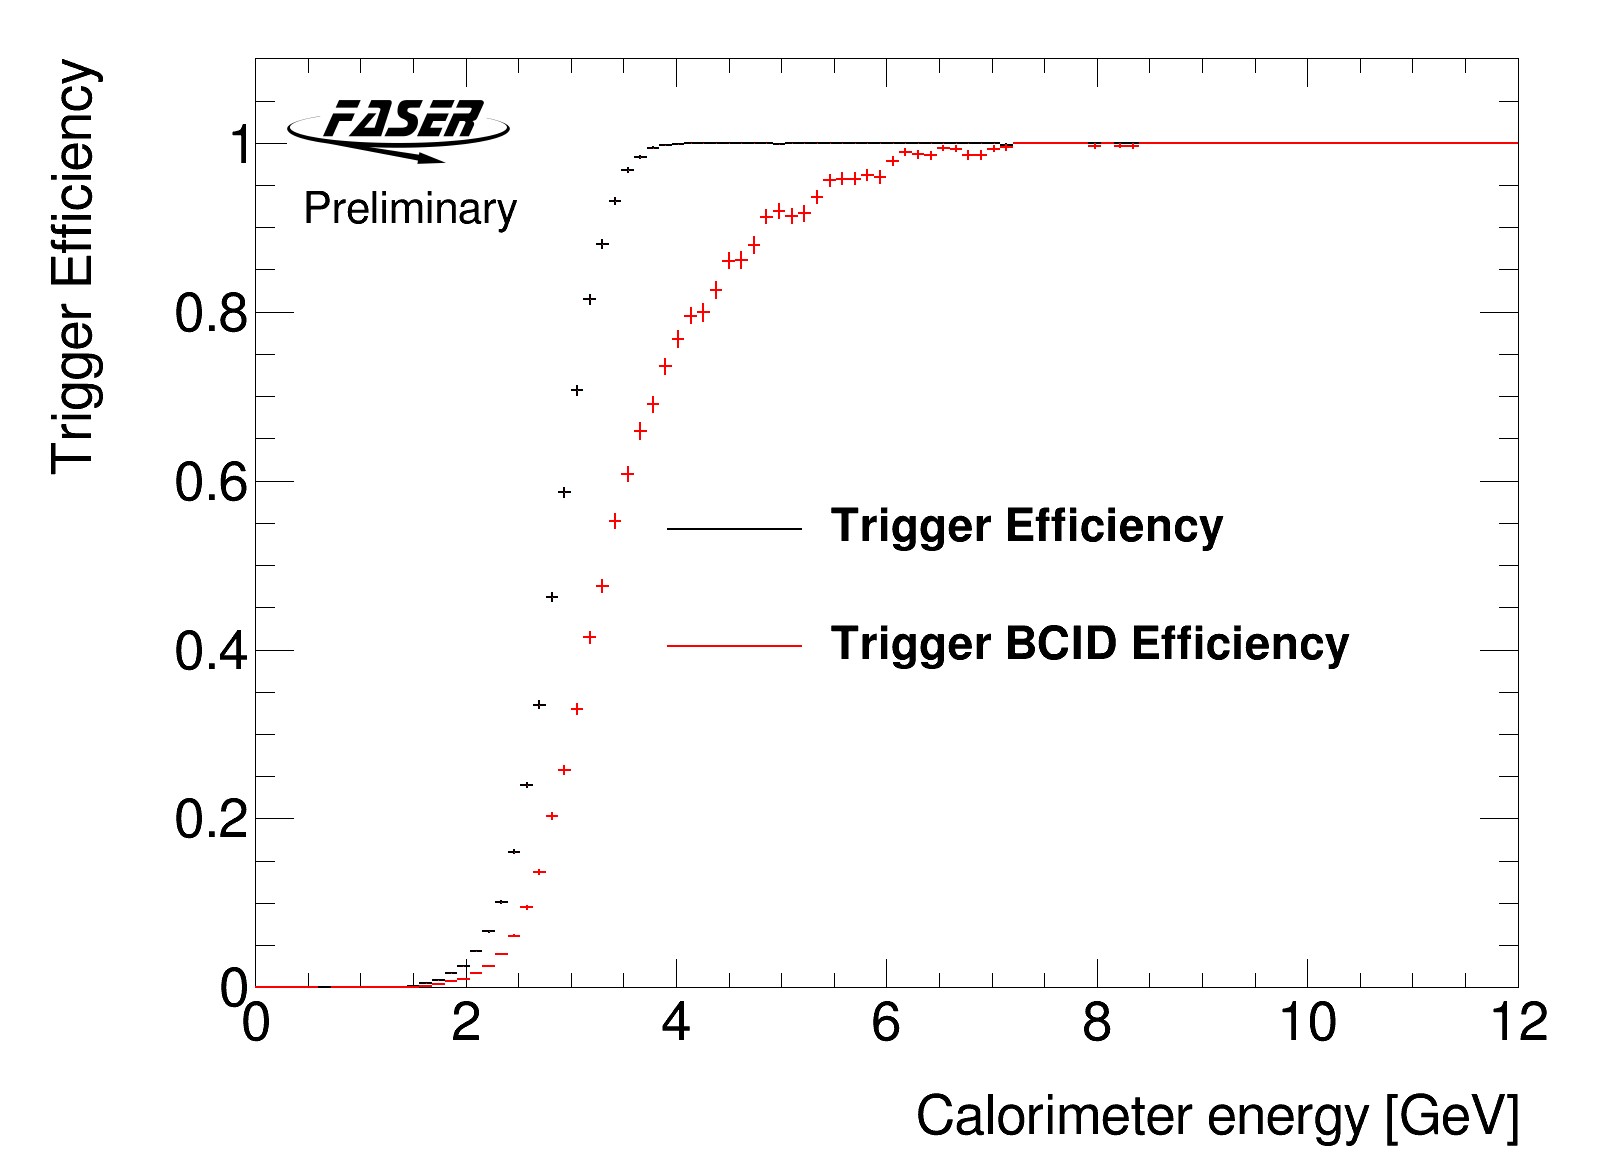
Calorimeter trigger turn on curves
The trigger efficiency of the calorimeter is shown as a function of EM energy. Here, we only use events that trigger the preshower, have a single track going through all FASER tracking stations, and have no saturated PMT signals. The trigger efficiency is then defined as how many events activated the calorimeter trigger divided by the total number of events. Both the total trigger efficiency (black) and the efficiency when requiring the trigger is within the correct BCID (red) are shown. The energy scale is calibrated using the observed MIP response assuming a MIP signal equivalent to a 330 MeV EM particle. For this data, the Calorimeter is at low gain and does not have the light filter installed.
|
 |
Scintillators |
FirstData |
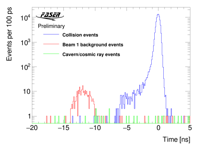
Calorimeter time separation of collision events and Beam1 bkg
The timing distribution of the Calorimeter is shown for large Calorimeter signals where the EM energy is above 4 GeV. In addition, an event selection is applied such that only events with unsaturated PMT signals are used. The BCID is then required to be consistent with a colliding bunch ID (blue), beam-1 background (red), or neither collision or beam-1 background compatible (green). The data was collected from LHC fills 8063, 8067, 8072, and 8076; corresponding to an integrated luminosity of 0.8 fb-1. The clean separation in time of collision and beam-1 background events allows us to efficiently reject the beam-1 background.
|
 |
Scintillators |
FirstData |
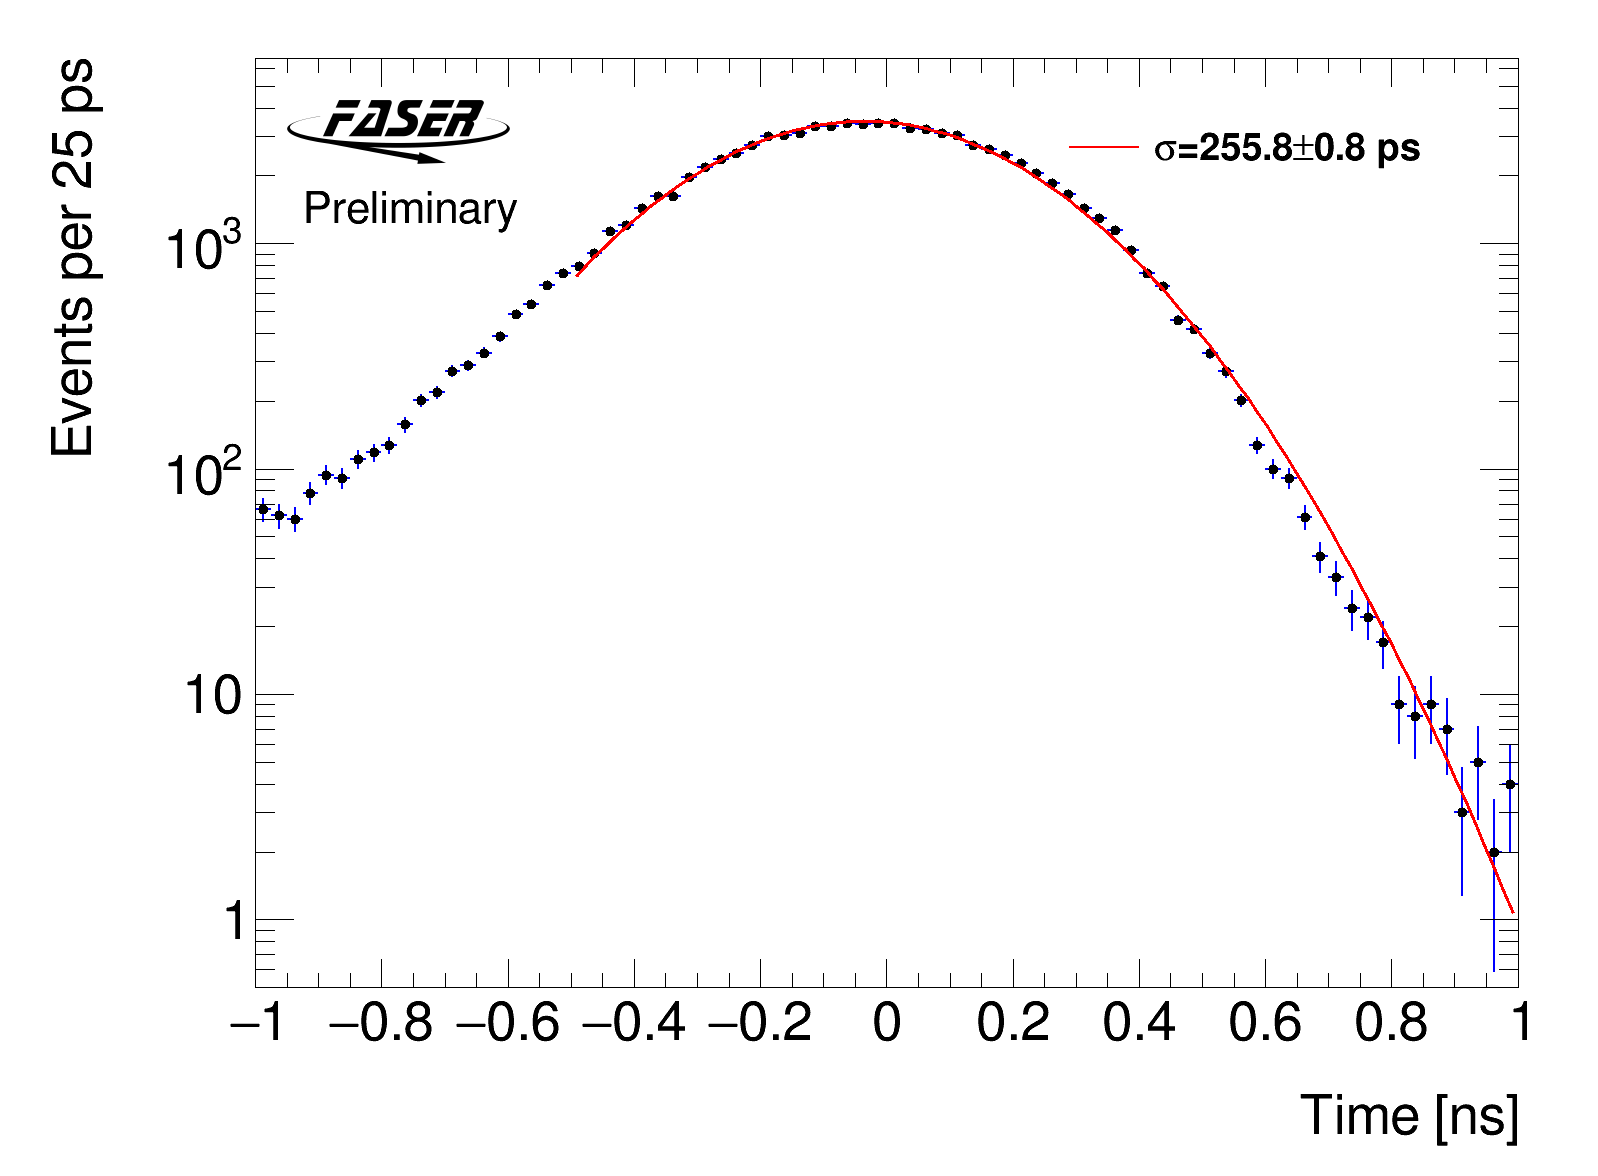
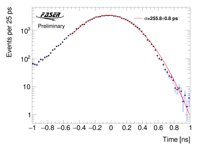
Calorimeter time distribution fit for large signals
The timing distribution of the Calorimeter is shown for large Calorimeter signals where the EM energy is above 4 GeV. In addition, an event selection is applied such that only events with unsaturated PMT signals are used. The BCID is then required to be consistent with a colliding bunch ID where there is no contribution from beam 1 background. The data was collected from LHC fills 8063, 8067, 8072, and 8076; corresponding to an integrated luminosity of 0.8 fb-1. The distribution was fit with a gaussian and a timing resolution of 256 ps was measured, which is close to the intrinsic 239 ps timing resolution of the LHC.
|
 |
Scintillators |
FirstData |
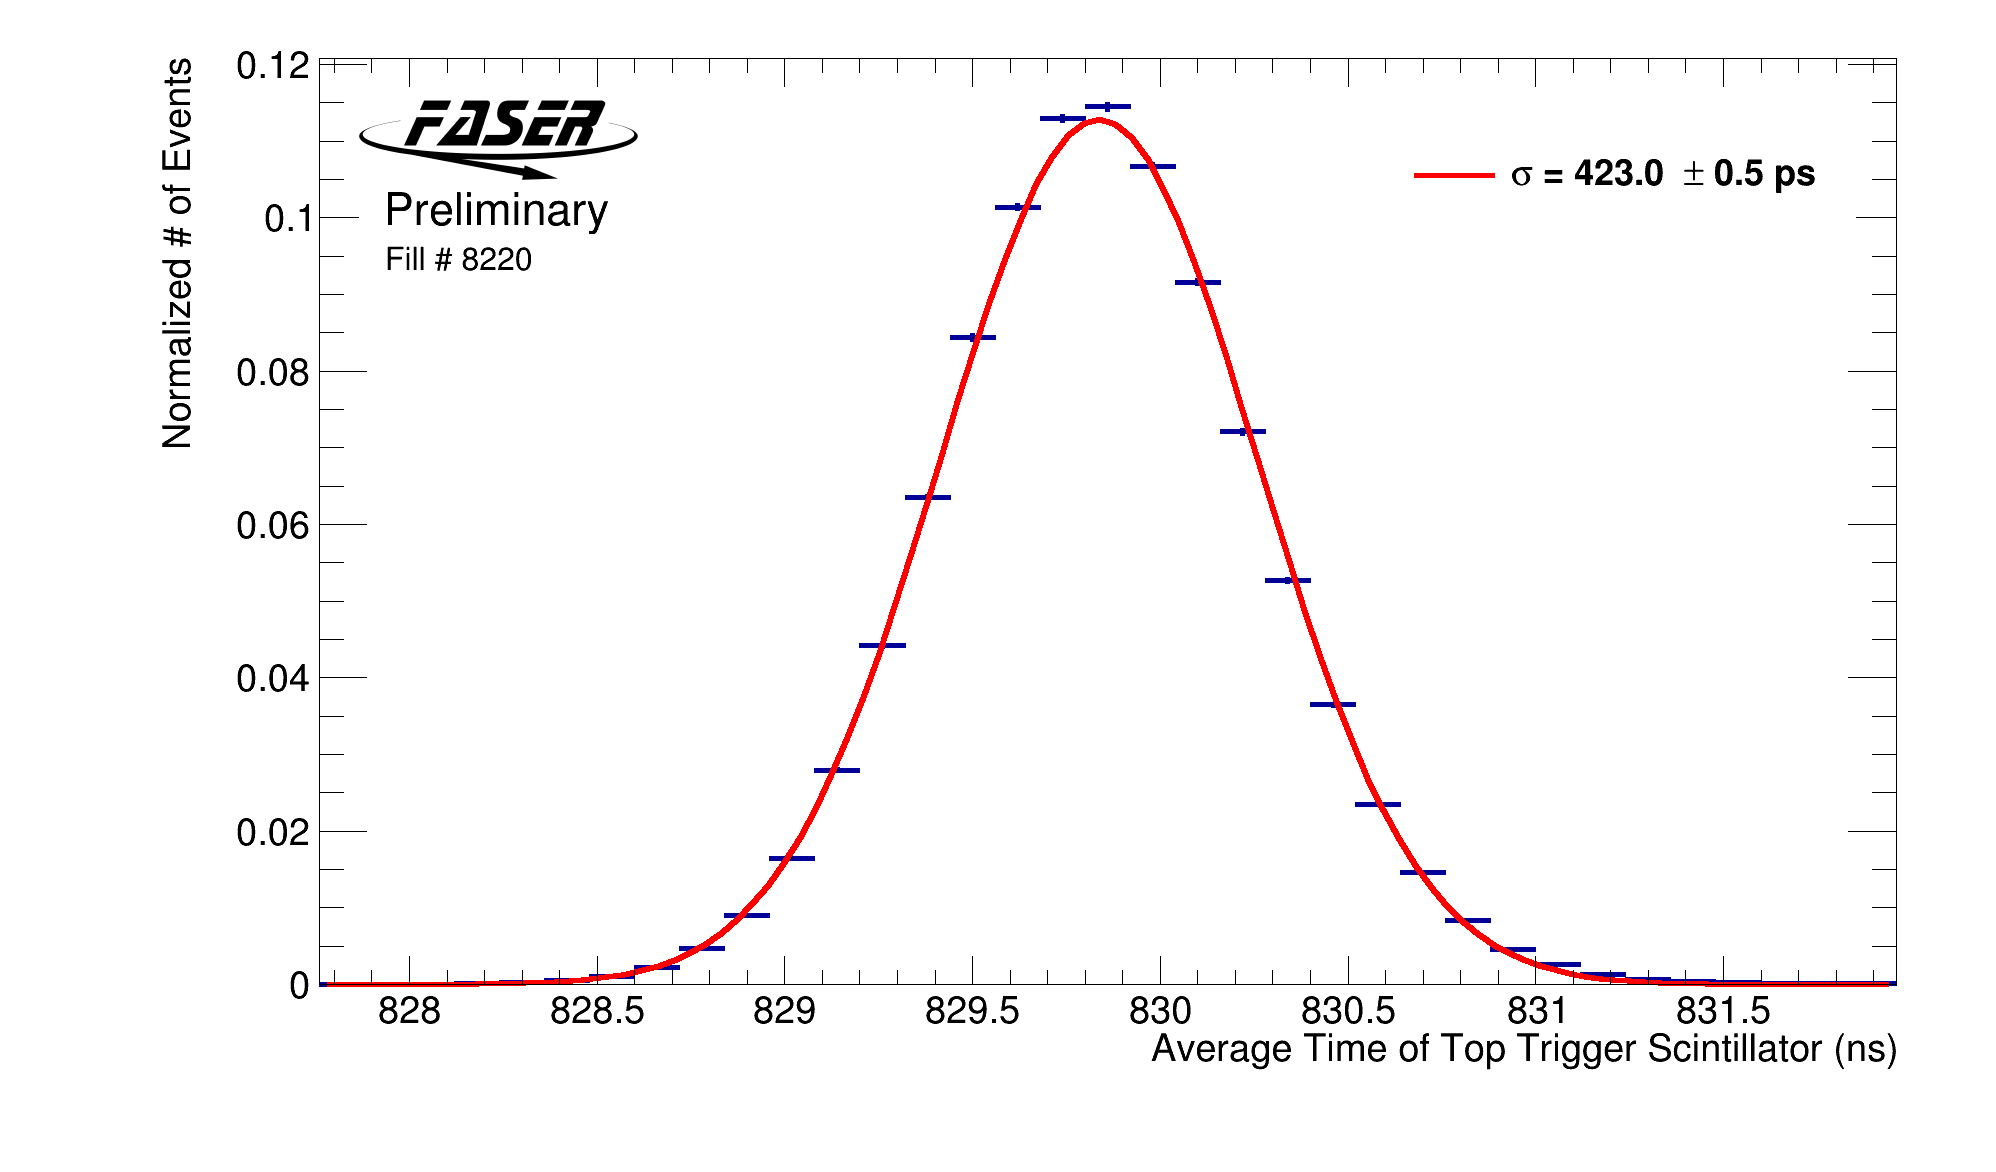
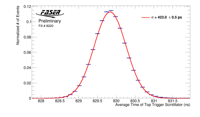
Timing distribution of top trigger scintillator
The timing distribution of the top Trigger scintillator is shown. Here, we only use events that had a single track going through all FASER tracking stations and was within the magnet aperture (r < 90mm ) when extrapolated to the Trigger scintillator. This plot uses data from LHC fill 8220, corresponding to an integrated luminosity of 463 pb-1. Since the Trigger scintillator has a PMT on both ends of the scintillator, we average the time of both PMTs to correct for time walk and get a timing resolution of 423.0 ± 0.5 ps when fitting the distribution with a Gaussian. The timing resolution of the bottom Trigger scintillator is similar.
|
 |
Scintillators |
FirstData |
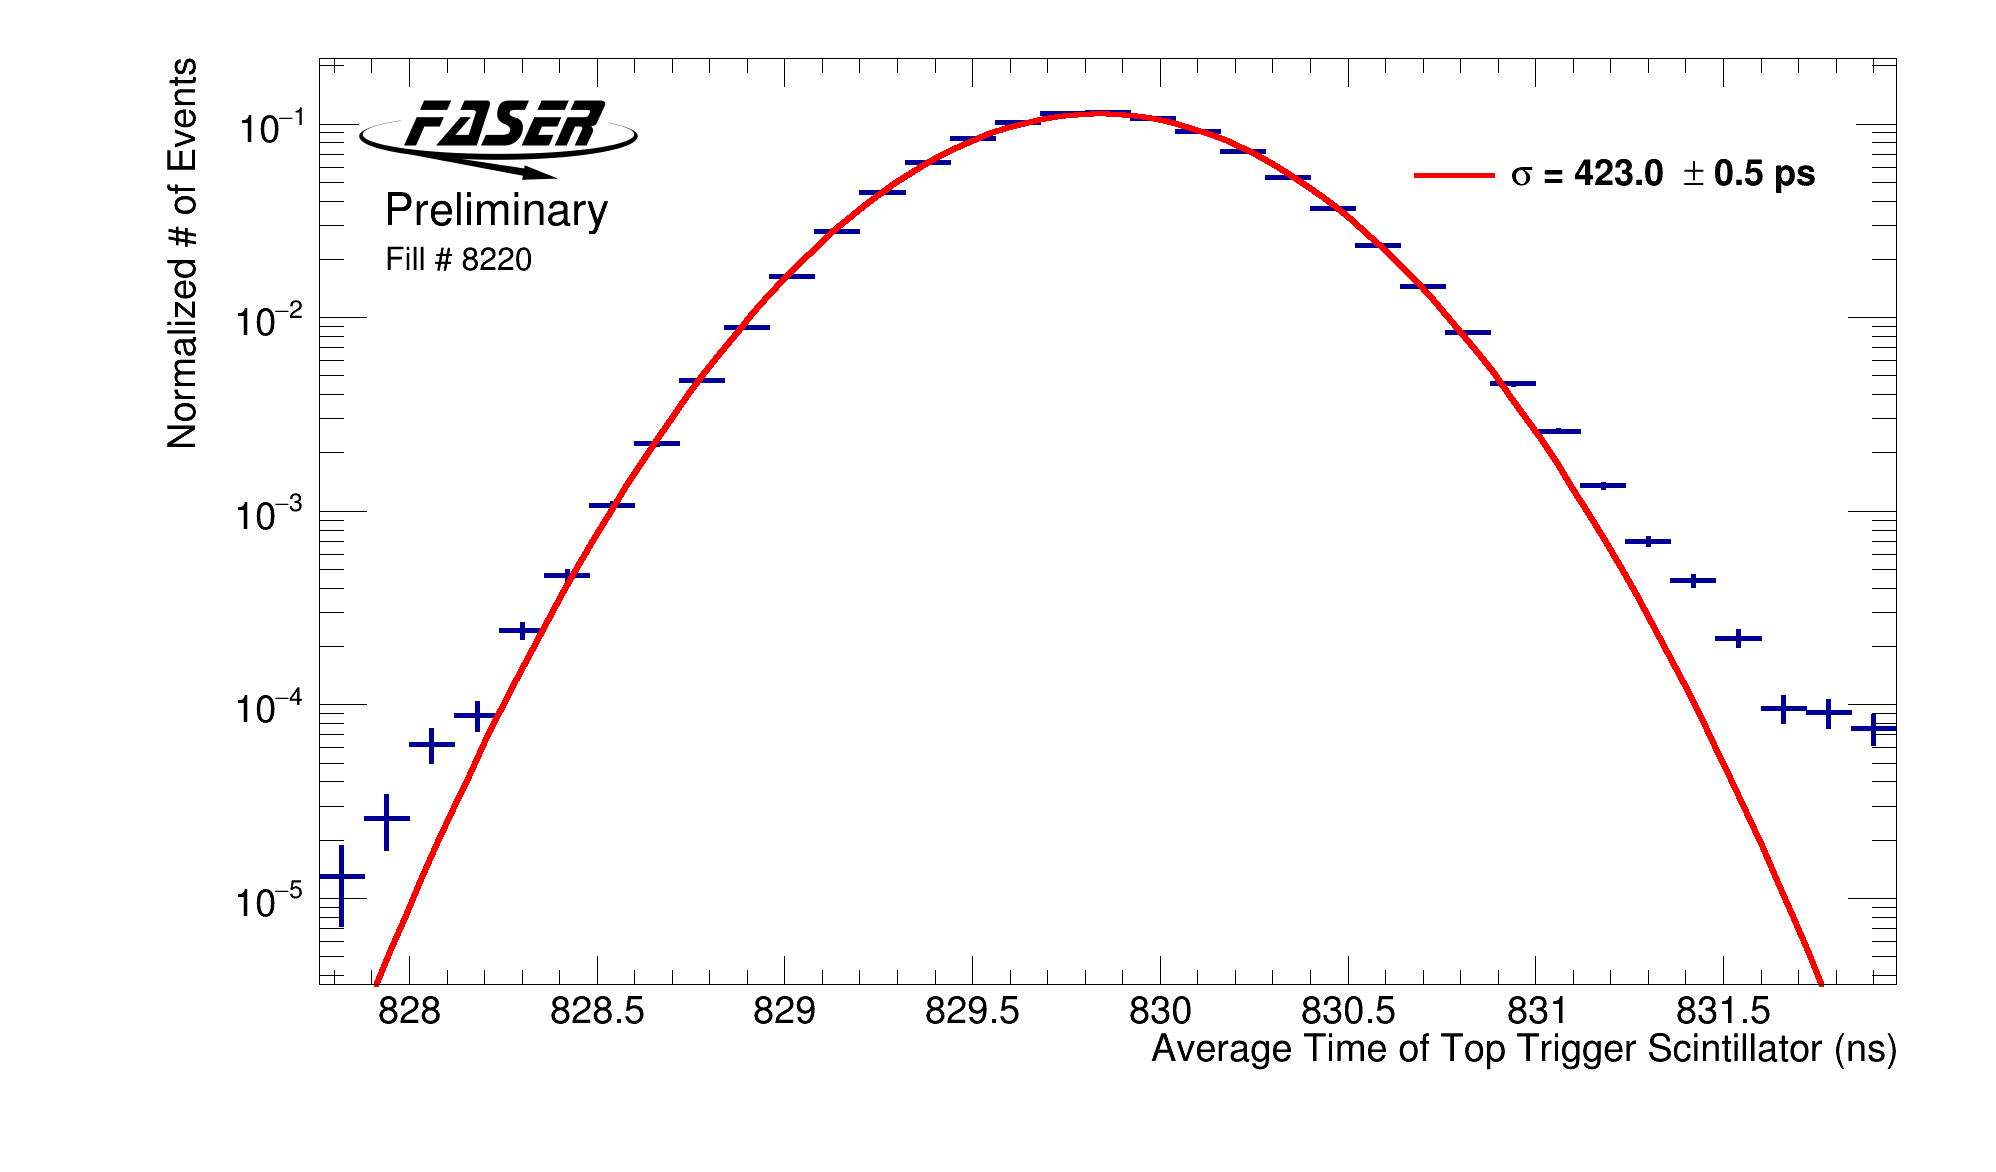
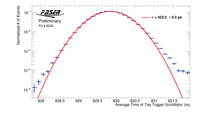
Timing distribution of top trigger scintillator (Log)
The timing distribution of the top Trigger scintillator is shown. Here, we only use events that had a single track going through all FASER tracking stations and was within the magnet aperture (r < 90mm ) when extrapolated to the Trigger scintillator. This plot uses data from LHC fill 8220, corresponding to an integrated luminosity of 463 pb-1. Since the Trigger scintillator has a PMT on both ends of the scintillator, we average the time of both PMTs to correct for time walk and get a timing resolution of 423.0 ± 0.5 ps when fitting the distribution with a Gaussian. The timing resolution of the bottom Trigger scintillator is similar.
|
 |
TDAQ |
DataSummary |
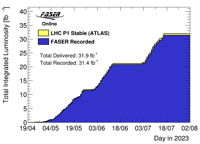
Cumulative luminosity versus time for 2023
The cumulative luminosity versus time delivered to (yellow) and recorded by FASER (blue) during stable beams for pp collisions at 13.6 TeV centre-of-mass energy in 2023. The luminosity information shown is provided by the ATLAS Collaboration using their latest calibration.
|
 |
TDAQ |
DataSummary |
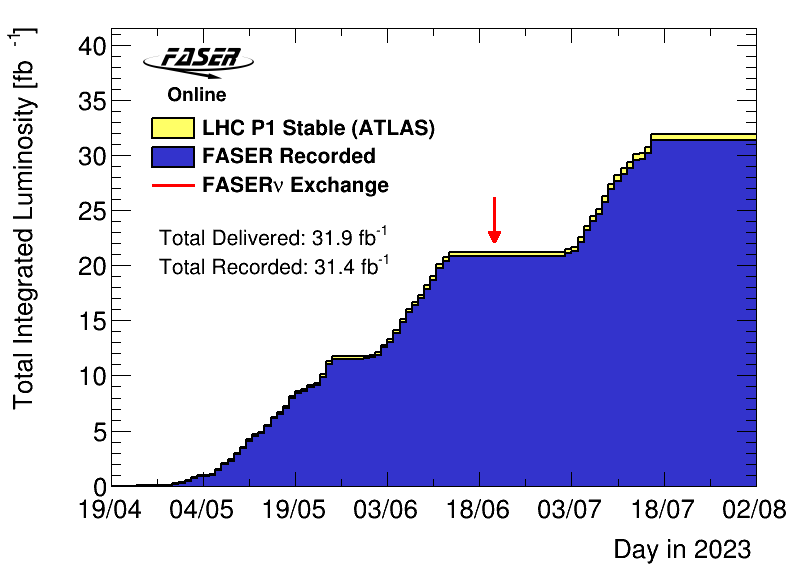
Cumulative luminosity versus time for 2023 (with markers)
The cumulative luminosity versus time delivered to (yellow) and recorded by FASER (blue) during stable beams for pp collisions at 13.6 TeV centre-of-mass energy in 2023. The luminosity information shown is provided by the ATLAS Collaboration using their latest calibration. The red arrow indicates the time when the FASERnu detector was exchanged.
|
 |
TDAQ |
DataSummary |
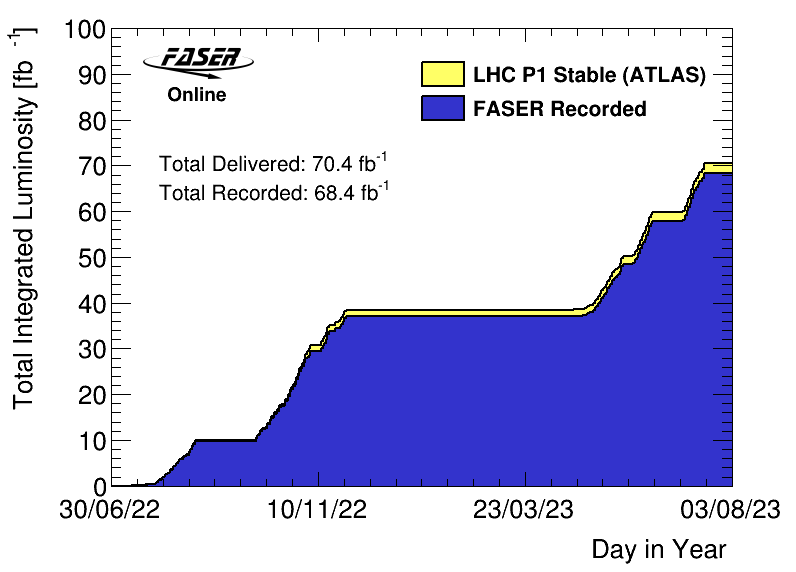
Cumulative luminosity versus time for 2022-2023
The cumulative luminosity versus time delivered to (yellow) and recorded by FASER (blue) during stable beams for pp collisions at 13.6 TeV centre-of-mass energy in 2022 and 2023. The luminosity information shown is provided by the ATLAS Collaboration using their latest calibration.
|
 |
TDAQ |
DataSummary |
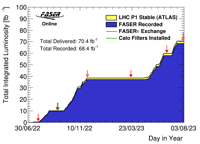
Cumulative luminosity versus time for 2022-2023 (with markers)
The cumulative luminosity versus time delivered to (yellow) and recorded by FASER (blue) during stable beams for pp collisions at 13.6 TeV centre-of-mass energy in 2022 and 2023. The luminosity information shown is provided by the ATLAS Collaboration using their latest calibration. The red arrow(s) indicate the time when the FASERnu detector was exchanged. The green arrow indicates the time at which the optical filters were installed into the calorimeter readout to allow the calorimeter to record high energy deposits without saturation.
|
 |
TDAQ |
FirstData |
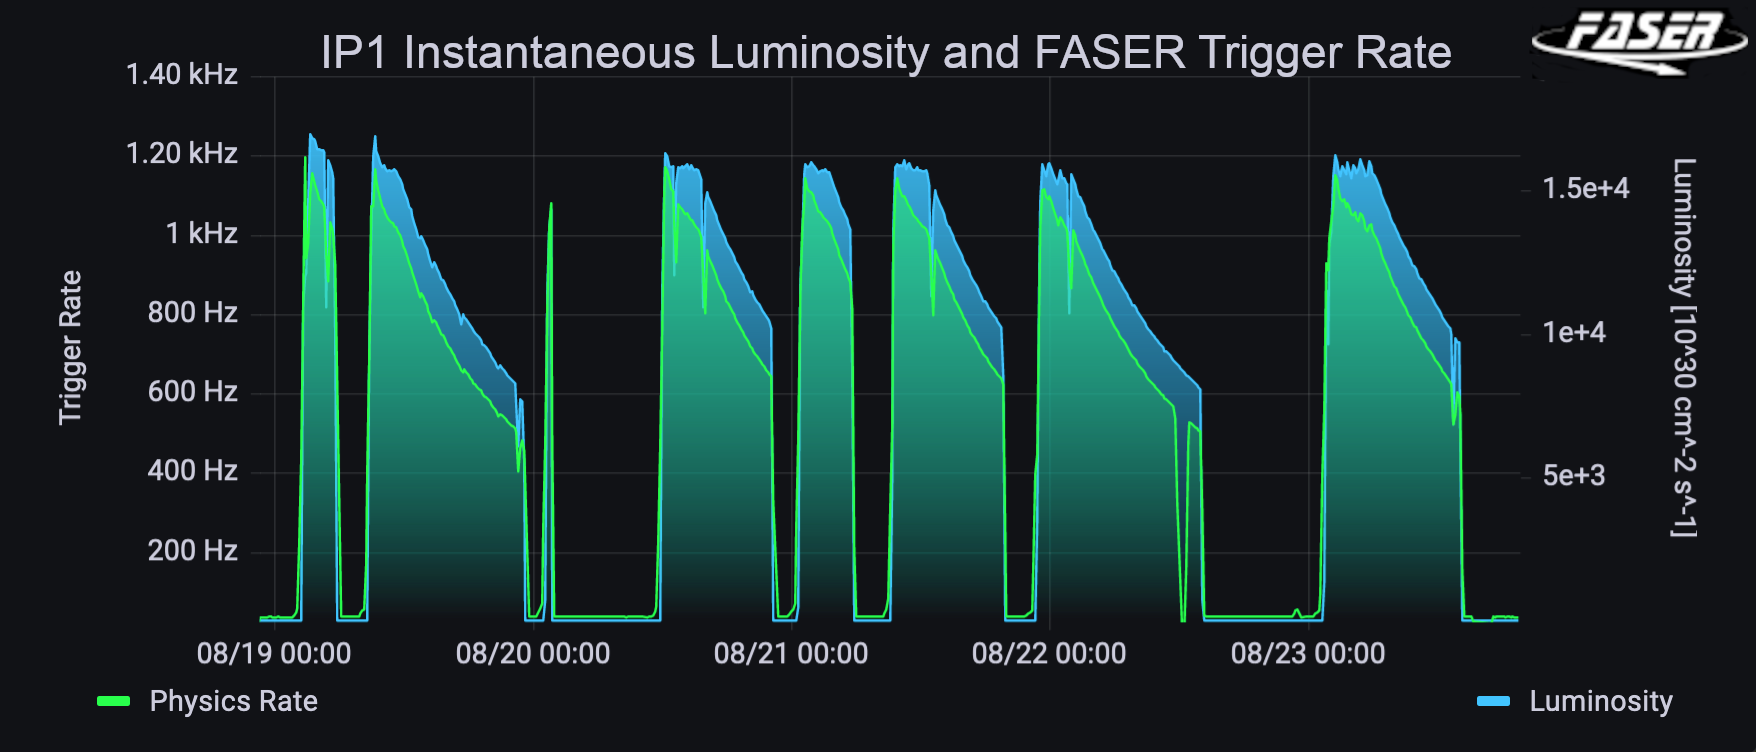
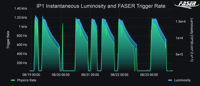
FASER trigger rate &and ATLAS instantaneous luminosity for August 2022 LHC fills
Superseded by: Figures/TDAQ/TrigOps2022/Screenshot_Grafana_LumivsTriggerRate_OctFills.pdf
The instantaneous luminosity measured at Interaction Point 1 and the
FASER total trigger recorded rate are shown for 8 LHC fills between
August 19th to 23rd, 2022 . The instantaneous luminosity as provided
by ATLAS, shown in blue, is given in units of inverse microbarns per second
(10^30 cm-2s-1). The trigger rate is shown in green, given in units of
Hz. The trigger rate trend generally follows the luminosity trend but
it is evident that the trigger rate falls off more strongly at the
beginning of fills than the luminosity. This is due to higher beam
losses at the beginning of fills. The dip in trigger rate towards the
end of the fill on the 22nd August was due to an issue with the
digitizer board which halted data taking for 1 hour and had been the
only issue experienced since start of data-taking. Other dips in rate
and luminosity are due to emission scans. The time is Central European
S ummer Time.
|
 |
TDAQ |
FirstData |
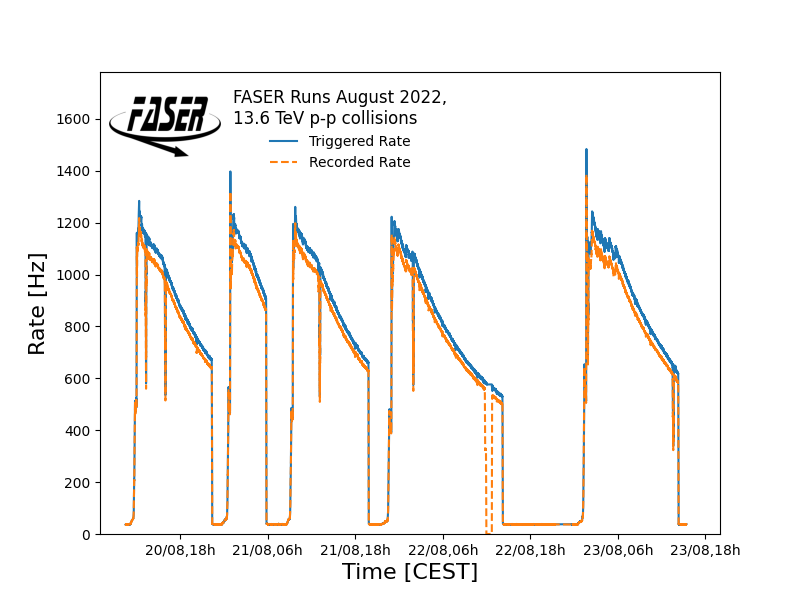
FASER triggered and recorded rate for August 2022 LHC fills.
The FASER triggered (blue line) and recorded (orange line) are shown
for 5 LHC fills between August 20th to 23rd 2022, with 2400 or 2448
colliding bunches. The elevated FASER trigger rates at the beginning
of a fill are due to the beams being put into collisions prior to the
insertion of the Roman Pots and associated collimators, TCL5 and TCL6,
downstream of the FASER location. The dip in trigger rate towards the
end of the fill on the 22nd August was due to an issue with the
digitizer board which halted data taking for 1 hour. This had been the
only issue experienced since start of data-taking. Other dips in rate
are due to emission scans. Time is given as Central European Summer
Time.
|
 |
TDAQ |
FirstData |
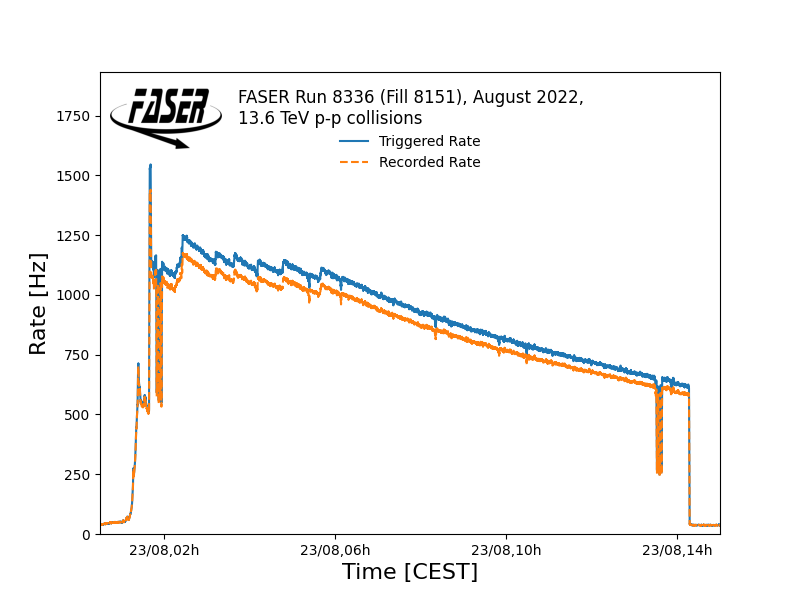
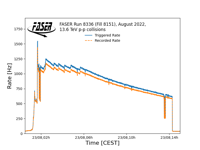
FASER triggered and recorded rate for FASER Run 8336 (23/08/2022)
Superseded by: Figures/TDAQ/TrigOps2022/triggered_vs_recorded_rate_TLBMonitoring-008913-00000.pdf
The FASER triggered (blue line) and recorded (orange line) are shown
for LHC Fill 8151 on 23rd August 2022. The LHC fill included
2461 filled and 2448 colliding bunches. A maximum FASER input rate of
around 1500 Hz is observed for the start of the run, when the beams
are put into collisions and before the Roman Pots and associated
collimators, TCL5 and TCL6, downstream of the FASER location, are
inserted. Rates drop down to around 1100 Hz after collimator
insertion. The dip in rate at around 02h00 and 13h30 is due to an
emittance scan at IP1. The LHC levelling at IP1 is evident in the
jagged rate steps. Time is given as Central European Summer Time.
|
 |
TDAQ |
FirstData |
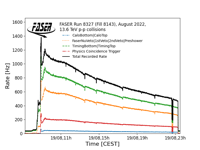
FASER recorded rate per trigger item for FASER Run 8327 (19/08/2022)
Superseded by: Figures/TDAQ/TrigOps2022/TrigItem_rates_TLBMonitoring-008913-00000.pdf
The FASER recorded trigger rates for each of the 4 FASER trigger menu
physics trigger items are shown for LHC Fill 8143 on 19th August
2022. The LHC fill contained 2413 filled and 2400 colliding
bunches. The dot-dot-dashed blue line represents the calorimeter
trigger, the dotted orange line represents a trigger signal in any
veto scintillator station or preshower scintillator station, the
striped green line represents the timing scintillator station trigger,
and the dot-dashed red line represents a coincidence trigger requiring
a coincidence between the foremost Veto scintillator station and the
preshower scintillator station at the end of the FASER detector. The
solid black line is the total recorded rate. No triggers are
prescaled. The elevated trigger rates at the beginning of the fill are
due to the beams being put into collision and before the Roman Pots
and associated collimators, TCL5 and TCL6 downstream of the FASER
location, are inserted. The dip in rate at 23h00 is due to an
emittance scan at IP1. The calorimeter trigger runs at the lowest rate
of around 50 Hz, while the Timing scintillator station trigger runs at
the highest rate at around 800 Hz for this particular fill. The total
trigger rate is less than the sum of each trigger item due to
overlapping triggers. Time is given in Central European Summer Time.
|
 |
TDAQ |
FirstData |
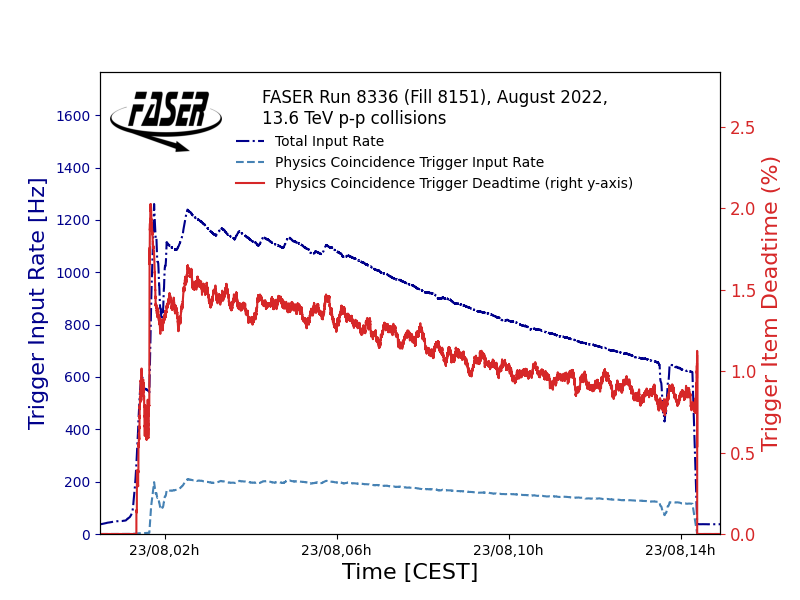
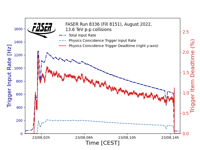
FASER total input rate, physics coincidence trigger input rate and deadtime for FASER Run 8336 (23/08/2022)
Superseded by: Figures/TDAQ/TrigOps2022/VetoedFractions_perTrigItem_TLBMonitoring-008913-00000.pdf
The FASER total input trigger rate as well as the input rate and
incurred deadtime for the physics coincident trigger are shown
superimposed for LHC Fill 8151 on 21st August 2022. The LHC fill
included 2461 filled and 2448 colliding bunches. The total input rate
and physics coincidence trigger input rate are given in units of Hz on
the left y-axis, as dot-dashed dark blue and dashed light blue lines,
respectively. The deadtime is given in percentage on the right
y-axis. The deadtime is defined as the difference between the number
of events triggered and the number of events recorded by the
coincidence trigger, as the fraction of the number of events triggered
by the coincidence trigger.
The physics coincidence trigger
selects events with coincident signal in the foremost veto
scintillator station and the preshower scintillator station at the
back of the detector, likely signifying the passage of an energetic
muon from the direction of IP1. The factor 6 smaller rate for the
coincidence trigger compared to the total input rate of all triggers,
demonstrates that our main triggered background is not muons passing
through from IP1 but particles triggering individual trigger stations.
|
 |
TDAQ |
FirstData |
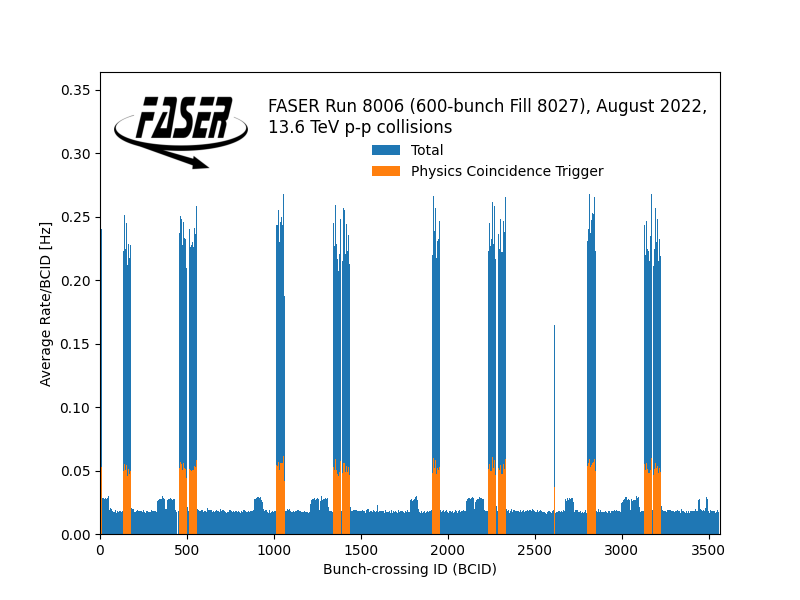
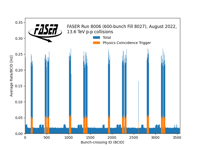
Average rate per bunch-crossing ID for FASER 600-bunch Run 8006 (August 2022)
The FASER average trigger rate per bunch-crossing position is shown for
LHC Fill 8027. The fill had 603 filled and 590 colliding bunches. The
blue bars represent the total recorded trigger rate, and the orange
bars represent the recorded trigger rate for the physics coincidence
trigger - a coincident trigger between a scintillator at the fron t
and back of the FASER detector, signifying the likely passage of an
energetic muon from the direction of IP1. The rate of the physics
coincidence trigger is zero for all but filled bunches.
|
 |
TDAQ |
FirstData |
Alert from FASER-bot in Mattermost
A snapshot of the FASER bot at work: Via a Grafana web hook, Grafana
alerts are posted to a dedicated FASER CERN Mattermost channel. On the
22nd of August 2022, an issue with the digitizer receiver was causing
all data to be vetoed due to the digitizer busy signal. The faser-bot
alert posts made remote shifters aware of the problem.
|
 |
TDAQ |
FirstData |
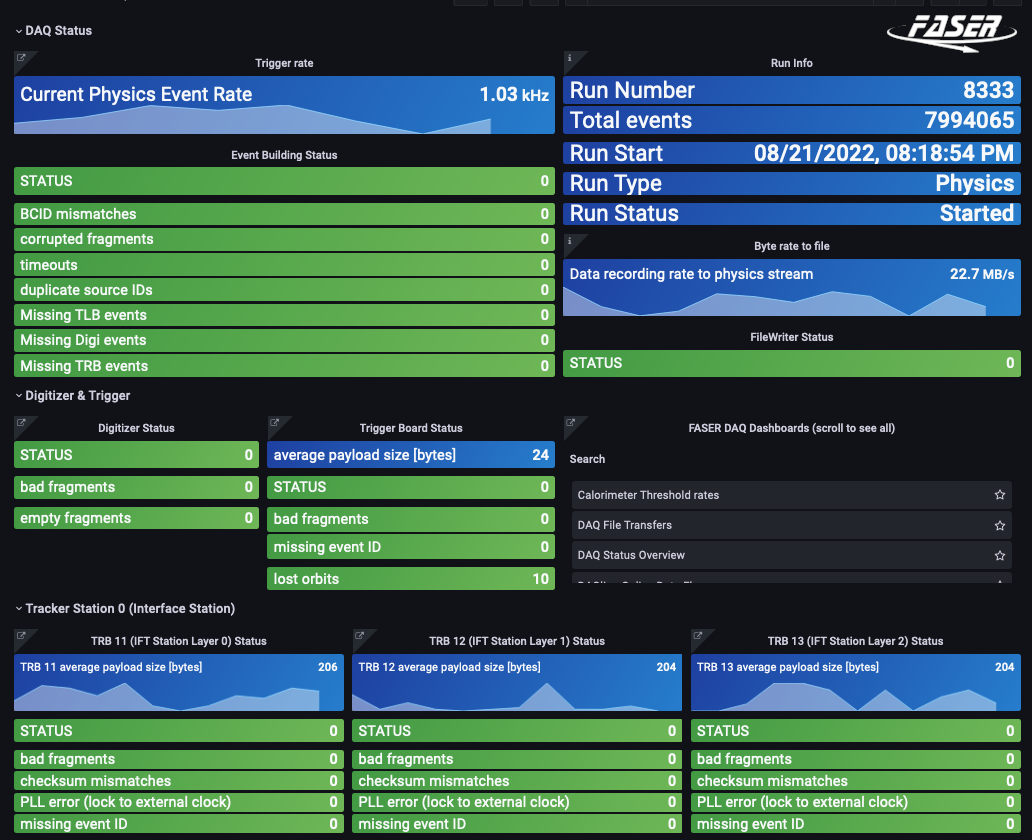
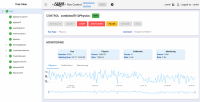
FASER Grafana DAQ Overview Dashboard (all green)
he FASER Grafana "DAQ Status Overview" dashboard for monitoring of the data acquisition, including the status of the DAQ receivers, the event builder and t
he file writer. The dashboard includes information on the current run, such as start time and run type, as well as fields monitoring error counts. Error count fields turn orange, the
n red, as the number of errors increase.
|
 |
TDAQ |
FirstData |
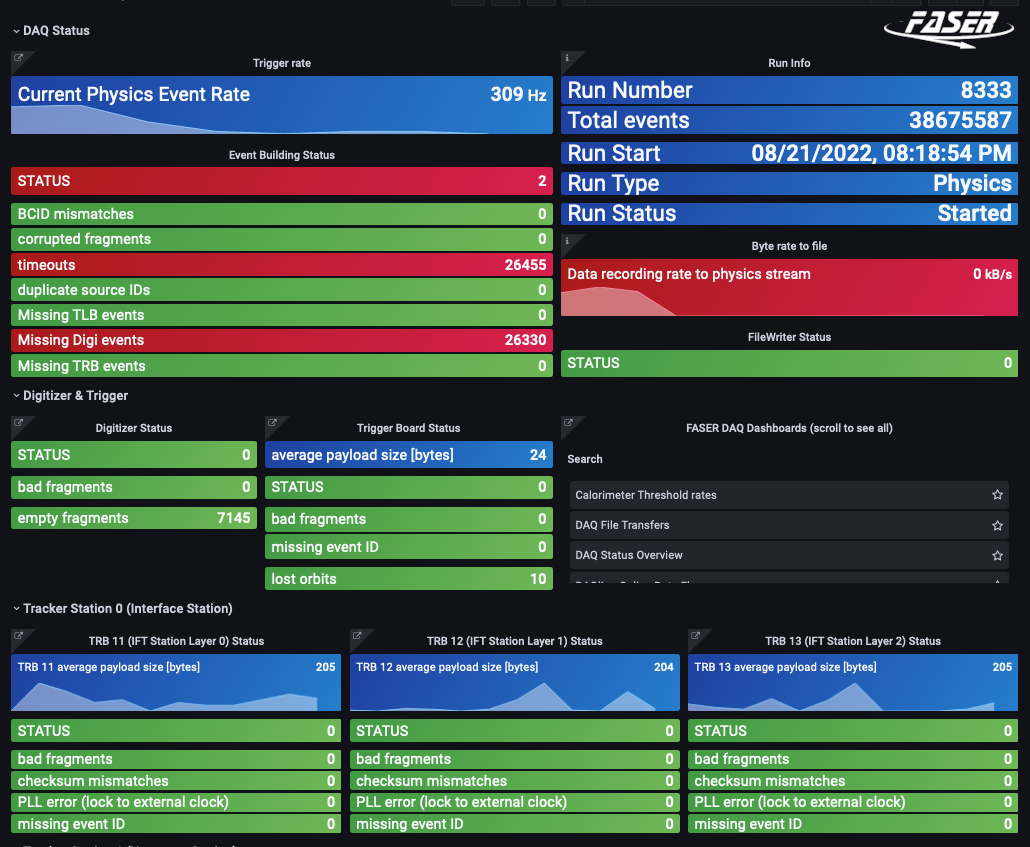
FASER Grafana DAQ Overview Dashboard (all red)
The FASER Grafana "DAQ Status Overview" dashboard for monitoring of
the data acquisition, including the status of the DAQ receivers, the
event builder and t he file writer. The dashboard includes information
on the current run, such as start time and run type, as well as fields
monitoring error counts. Error count fields turn orange, the n red, as
the number of errors increase.
|
 |
TDAQ |
FirstData |
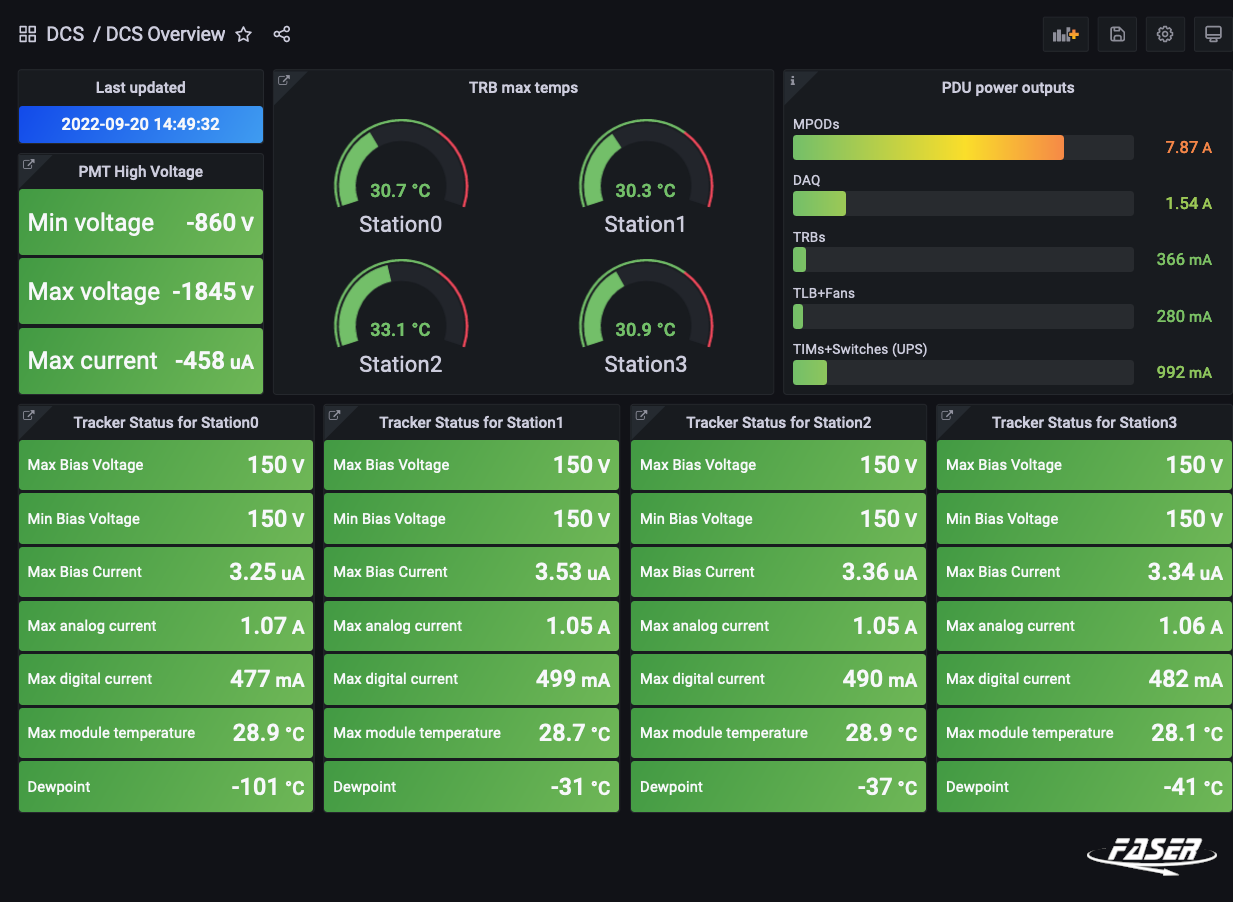
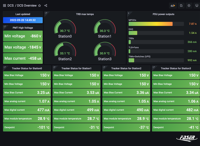
FASER Grafana DCS Overview Dashboard
The FASER Grafana "DCS Status Overview" dashboard for monitoring of
the detector control system's control values, including the voltage of
the scintillator photomultipliers, the bias voltage and current of
each tracker station, tracker temperatures and dew point and power
output of equipment on and off detector.
|
 |
TDAQ |
FirstData |
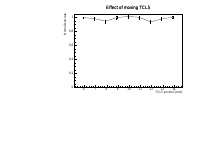
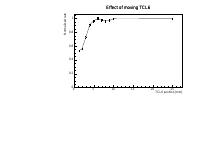
FASER rate versus TCL5 position
These plots show the observed change in the FASER trigger rate, during
a dedicated test where the TCL5 and TCL6 collimator settings were
changed in July 2022. The TCL collimators are situated on the outgoing
beam between the ATLAS collision point and FASER. The x-axis shows the
distance of the collimator from the beam, and the y-axis the trigger
rate normalised to the rate with the collimators open (TCL6 25mm from
the beam, TCL5 14mm from the beam). The plots show there is a strong
dependence of the FASER trigger rate on the TCL6 collimator settings,
whereas the TCL5 settings do not effect the rate.
|
 |
TDAQ |
FirstData |
FASER rate versus TCL6 position
These plots show the observed change in the FASER trigger rate, during
a dedicated test where the TCL5 and TCL6 collimator settings were
changed in July 2022. The TCL collimators are situated on the outgoing
beam between the ATLAS collision point and FASER. The x-axis shows the
distance of the collimator from the beam, and the y-axis the trigger
rate normalised to the rate with the collimators open (TCL6 25mm from
the beam, TCL5 14mm from the beam). The plots show there is a strong
dependence of the FASER trigger rate on the TCL6 collimator settings,
whereas the TCL5 settings do not effect the rate.
|
 |
TDAQ |
TrigOps2022 |
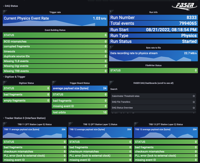
FASER Run Control GUI
A snapshot of the FASER Run Control GUI, showing the control buttons for the DAQ Finite State Machine, the control tree of added DAQ modules (data receivers, monitoring modules, event builder and file writer) and a main monitoring panel showing the current run information and current rates.
|
 |
TDAQ |
TrigOps2022 |
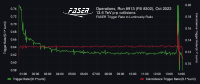
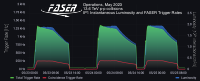
FASER trigger rates and ATLAS instantaneous luminosity for single October fill
The instantaneous luminosity measured at Interaction Point 1 and the FASER total and coincidence trigger recorded rate are shown for
FASER Run 8913 (LHC Fill 8303) recorded on 22nd October 2022. The instantaneous luminosity as provided by ATLAS, shown in blue, is given in units of 10^34 cm-2s-1. The total trigger rate is shown in green. The rate of a coincidence trigger (requiring a signal in
the veto scintillators at the front and the preshower scintillator layer at the back of FASER, likely signifying the passage of an energetic muon from the direction of IP1) is shown in red. The trigger rate trend generally follows the luminosity but it is evident that the trigger rate falls off more strongly at the beginning of the fill than the luminosity. This is due to higher beam-induced backgrounds at the beginning of the fill. The dip in rate towards the end of the fill is due to an emittance scan at IP1. The time is Central European Summer Time.
|
 |
TDAQ |
TrigOps2022 |
FASER trigger rates and ATLAS instantaneous luminosity for October 2022 LHC fills
The instantaneous luminosity measured at Interaction Point 1 and the FASER total and coincidence trigger recorded rate are shown for 4 LHC fills between October 22nd and 24th, 2022. The instantaneous luminosity as provided by ATLAS, shown in blue, is given in units of 10^-34 cm-2s-1. The total trigger rate is shown in green. The rate of a coincidence trigger requiring a signal in
the veto scintillators at the front and the preshower scintillator layer at the back of FASER (likely signifying the passage of an energetic muon from the direction of IP1), is shown in red. The trigger rate trend generally follows the luminosity but it is evident that the trigger rate falls off more strongly at the beginning of fills than the luminosity. This is due to higher beam-induced backgrounds at the beginning of each fill. The time is Central European Summer Time.
|
 |
TDAQ |
TrigOps2022 |
Ratio of FASER Trigger Rates to IP1 Instantaneous Luminosity
The ratio of the total (green) and the coincidence (red) FASER trigger rate to the instantaneous luminosity measured at Interaction Point 1 are shown for FASER Run 8913 (LHC Fill 8302) recorded on 22nd October 2022. The instantaneous luminosity (provided in units 10^34 cm-2s-1) is scaled by a factor 0.1 so that both factors in the ratio are of the same magnitude. The coincidence trigger requires a signal in the veto scintillators at the front and the preshower scintillator layer at the back of FASER, likely signifying the passage of an energetic muon from the direction of IP1. It is evident that the total trigger rate is not directly correlated with the instantaneous luminosity. It instead falls off exponentially at the start of a fill with respect to the luminosity before levelling off to a constant ratio. This is due to higher beam-induced backgrounds at the beginning of the fill of low energy particles triggering individual scintillator stations. The coincidence trigger on the other hand is shown to be more or less perfectly correlated with the instantaneous luminosity. The spikes towards the end of the fill is due to an emittance scan at IP1. The time is Central European Summer Time.
|
 |
TDAQ |
TrigOps2022 |
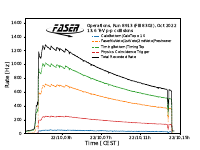
FASER recorded rate per trigger item for FASER Run 8913 (22/10/2022)
The FASER recorded trigger rates for each of the 4 FASER trigger menu physics trigger items are shown for FASER Run 8913
(LHC Fill 8302) on 22nd October 2022. The LHC fill contained 2450 (2462) colliding (filled) bunches. The peak luminosity was 1.95x10^34 cm-2s-1.
The dot-dot-dashed blue line represents the very low rate of the calorimeter trigger scaled up by a factor 10. Due to the nominal physics low gain setting and optical filters for the calorimeter PMTs, the calorimeter triggers on signals above 30 GeV. The dotted orange line represents a trigger signal in any veto scintillator station or preshower scintillator station, the striped green line represents the timing scintillator station trigger, and the dot-dashed red line represents a coincidence trigger requiring a coincidence between the foremost Veto scintillator station and the preshower scintillator station at the end of the FASER detector, likely signifying the passage of an energetic muon from the direction of IP1. The scintillator thresholds are set to just below a MIP signal. The solid black line is the total recorded rate. No triggers are prescaled. The dip in rate towards the end of the fill is due to an emittance scan at IP1. The calorimeter trigger runs at the lowest rate at a peak rate of around 2.5 Hz, while the Timing scintillator station trigger runs at the highest rate at a maximum rate of 1000 Hz for this particular fill. The total trigger rate is less than the sum of each trigger item due to overlapping triggers. Time is given in Central European Summer Time.
|
 |
TDAQ |
TrigOps2022 |
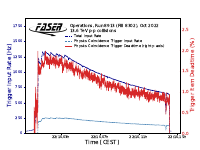
FASER total input rate, physics coincidence trigger input rate and deadtime for FASER Run 8913 (22/10/2022)
The FASER total input trigger rate as well as the input rate and incurred deadtime for the physics coincident trigger are shown superimposed for FASER Run 8913 (LHC Fill 8302) on 22nd October 2022. The LHC fill contained 2450 (2462) colliding (filled) bunches. The peak luminosity was 1.95x10^34 cm-2s-1.
The total input rate and physics coincidence trigger input rate are given in units of Hz on the left y-axis, as dot-dashed dark blue and dashed light blue lines, respectively. The deadtime is given in percentage on the right y-axis. The deadtime is defined as the difference between the number of events triggered and the number of events recorded by the coincidence trigger, as the fraction of the number of events triggered by the coincidence trigger. The dip in rate towards the end of the fill is due to an emittance scan at IP1.
The physics coincidence trigger selects events with coincident signal in the foremost veto scintillator station and the preshower scintillator station at the back of the detector, likely signifying the passage of an energetic muon from the direction of IP1. The factor 6 smaller rate for the coincidence trigger compared to the total input rate of all triggers, demonstrates that our main triggered background is not muons passing through from IP1 but particles triggering individual trigger stations.
|
 |
TDAQ |
TrigOps2022 |
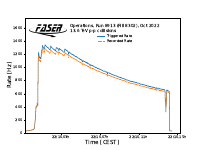
FASER triggered and recorded rate for FASER Run 8913 (22/10/2022)
The FASER triggered (blue line) and recorded (orange line) are shown for FASER Run 8913 (LHC Fill 8302) on 22nd October 2022.
The LHC fill contained 2450 (2462) colliding (filled) bunches. The peak luminosity was 1.95x10^34 cm-2s-1. A maximum FASER input rate of around 1300 Hz is oserved at the start of the fill. The dip in rate towards the end of the fill is due to an emittance scan at IP1. The LHC levelling at IP1 is evident in the jagged rate steps. Time is given as Central European Summer Time.
|
 |
TDAQ |
TrigOps2023 |
FASER trigger rates and ATLAS instantaneous luminosity for May 2023 LHC fills
The instantaneous luminosity measured at Interaction Point 1 and the FASER total and coincidence trigger recorded rate are shown for 3 LHC fills between May 23rd and 25th, 2023. The instantaneous luminosity as provided by ATLAS, shown in blue, is given in units of 10^34 cm-2s-1. The total trigger rate is shown in green. The rate of a coincidence trigger requiring a signal in the veto scintillators at the front and the
preshower scintillator layer at the back of FASER, is shown in red. The trigger rate trend generally follows the luminosity but it is evident that the trigger rate falls off more strongly at the beginning of fills than the luminosity. This is due to higher beam-induced backgrounds at the beginning of each fill. The time is Central European Summer Time.
|
 |
TDAQ |
TrigOps2023 |
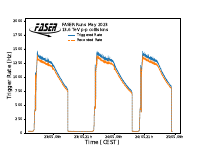
FASER triggered and recorded rate for May 2023 LHC fills
The FASER triggered (blue line) and recorded (orange line) are shown for 3 LHC fills between May 23rd and 25th, 2023, with 2345 colliding bunches. Time is given as Central European Summer Time.
|
 |
TDAQ |
TrigOps2023 |
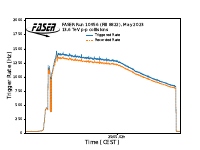
FASER triggered and recorded rate for FASER Run 10956 (24/05/2023)
The FASER triggered (blue line) and recorded (orange line) are shown for FASER Run 10956 (LHC Fill 8822) on 24th May 2023.
The LHC fill contained 2358 (2358) colliding (filled) bunches. The peak luminosity was 2.01 x 10^34 cm-2s-1. A maximum FASER input rate of around 1380 Hz is observed at the start of the fill.
|
 |
TDAQ |
TrigOps2023 |
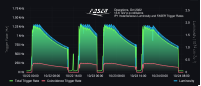
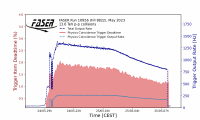
FASER total input rate, physics coincidence trigger input rate and deadtime for FASER Run 10956 (24/05/2023)
The FASER total input trigger rate as well as the input rate and incurred deadtime for the physics coincident trigger are shown superimposed for FASER Run 10956 (LHC Fill 8822) on 24th May 2023. The LHC fill contained 2358 (2358) colliding (filled) bunches. The peak luminosity was 2.01 x 10^34 cm-2s-1. The total input rate and physics coincidence trigger input rate are given in units of Hz on the right y-axis, as dot-dashed dark blue and dashed light blue lines, respectively. The deadtime is given in percentage on the left y-axis. The deadtime is defined as the difference between the number of events triggered and the number of events recorded by the coincidence trigger, over the number of events triggered by the coincidence trigger. The physics coincidence trigger selects events with coincident signal in a front veto scintillator station and the preshower scintillator station at the back of the detector, likely signifying the passage of an energetic muon from the direction of IP1. The factor 6 smaller rate for the coincidence trigger compared to the total input rate of all triggers, demonstrates that our main triggered background is not muons passing through from IP1 but particles triggering individual trigger stations.
|
 |
TDAQ |
TrigOps2024 |
FASER trigger rates and ATLAS instantaneous luminosity for May 2024 LHC fills
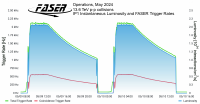
A screenshot of a FASER Grafana online monitoring graph of the instantaneous luminosity measured at Interaction Point 1 and the FASER total and coincidence trigger recorded rate is shown for 2 LHC fills between May 9th and 10th, 2024. The instantaneous luminosity as provided by ATLAS, shown in blue, is given in units of 10^34 interactions/cm2/s. The total trigger output rate is shown in green. The output rate of a coincidence trigger requiring a signal in one of the veto scintillators at the front and the preshower scintillator layer at the back of FASER, is shown in red. A roughly factor 1.6 higher trigger rate is measured in 2024 compared to 2023, which is attributed to new reverse polarity optics in 2024 for reducing radiation for IP1 triplet magnets. Specifically, for matching optics for reversed polarity of the triplet magnets, the Q4 magnet that formerly helped shield FASER, is off in 2024.
|
 |
TDAQ |
TrigOps2024 |
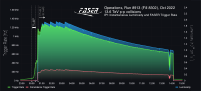
FASER total output rate, physics coincidence trigger output rate and deadtime for FASER Run 15394 (25/05/2024)
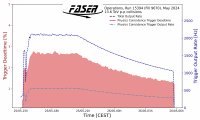
The FASER total trigger output rate as well as the output rate and incurred deadtime for the physics coincidence trigger are shown superimposed for FASER Run 15394 (LHC Fill 9670) on 25th May 2024. The LHC fill contained 2340 (2352) colliding (filled) bunches. The peak luminosity was 2.13 x 10^34 cm-2s-1. The total output rate and physics coincidence trigger output rate are given in units of Hz on the right y-axis, as dashed dark blue and dot-dashed light blue lines, respectively. The deadtime is given in percentage on the left y-axis. The deadtime is defined as the difference between the number of events triggered and the number of events recorded by the coincidence trigger, over the number of events triggered by the coincidence trigger. The physics coincidence trigger selects events with coincident signals in a front veto scintillator station and the preshower scintillator station at the back of the detector, likely signifying the passage of an energetic muon from the direction of IP1. The factor 6 smaller rate for the coincidence trigger compared to the total input rate of all triggers, demonstrates that our main triggered background is not muons passing through from IP1 but particles triggering individual trigger stations. The mean measured coincidence trigger deadtime over the full fill is 2.1%.
|
 |
Tracker |
Alignment |
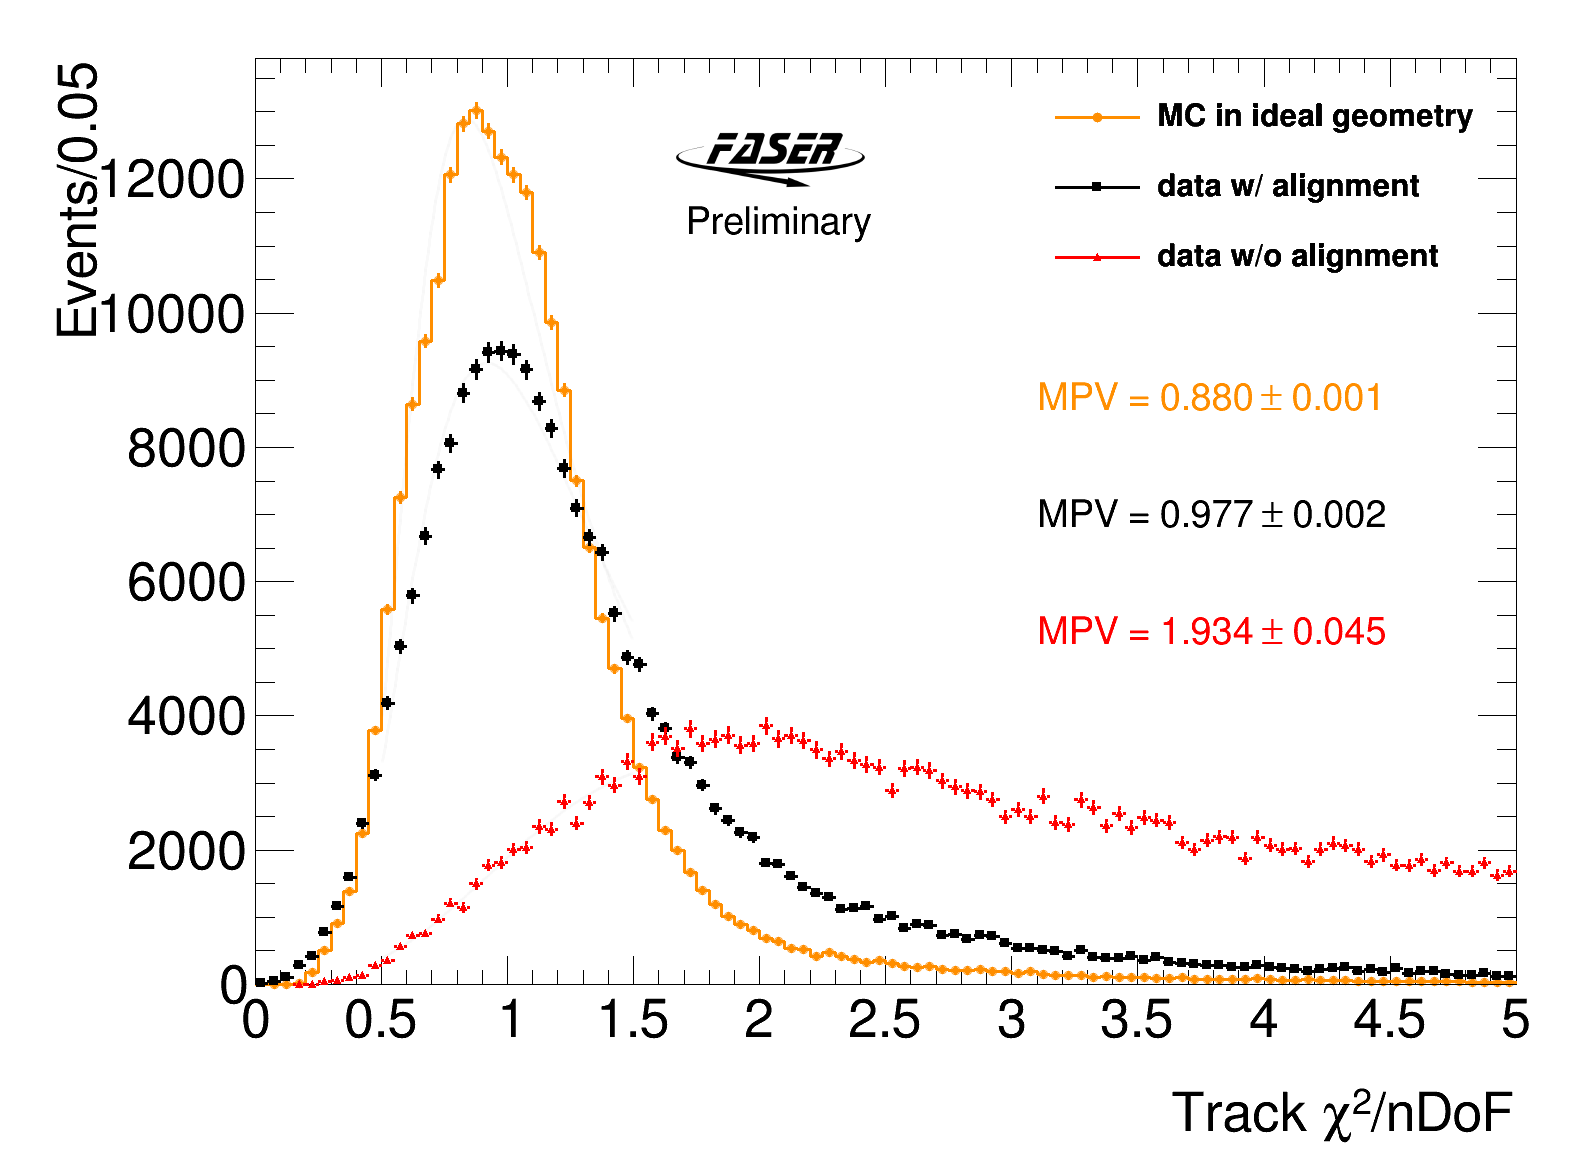
Comparison of track chi2 distributions
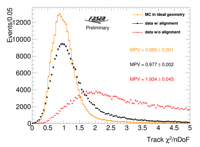
The distribution of track chi2 over the number of degree of freedoms for the tracks reconstructed from MC simulation in ideal geometry (orange), from data in original geometry (red), and from data in aligned geometry (black) with an integrated luminosity of 596 pb-1. Only the tracks with chi2 less than 200, momentum greater than 300 GeV, and the number of clusters greater than 14 are used. The distributions have been normalized to the same number of entries. Three tracker stations (no interface station) are used in the track reconstruction. Each distribution is fitted by a chi2 function and the most probable value is listed. The distribution from collision data is improved significantly with alignment and is approaching to the MC simulation in ideal geometry.
|
 |
Tracker |
Alignment |
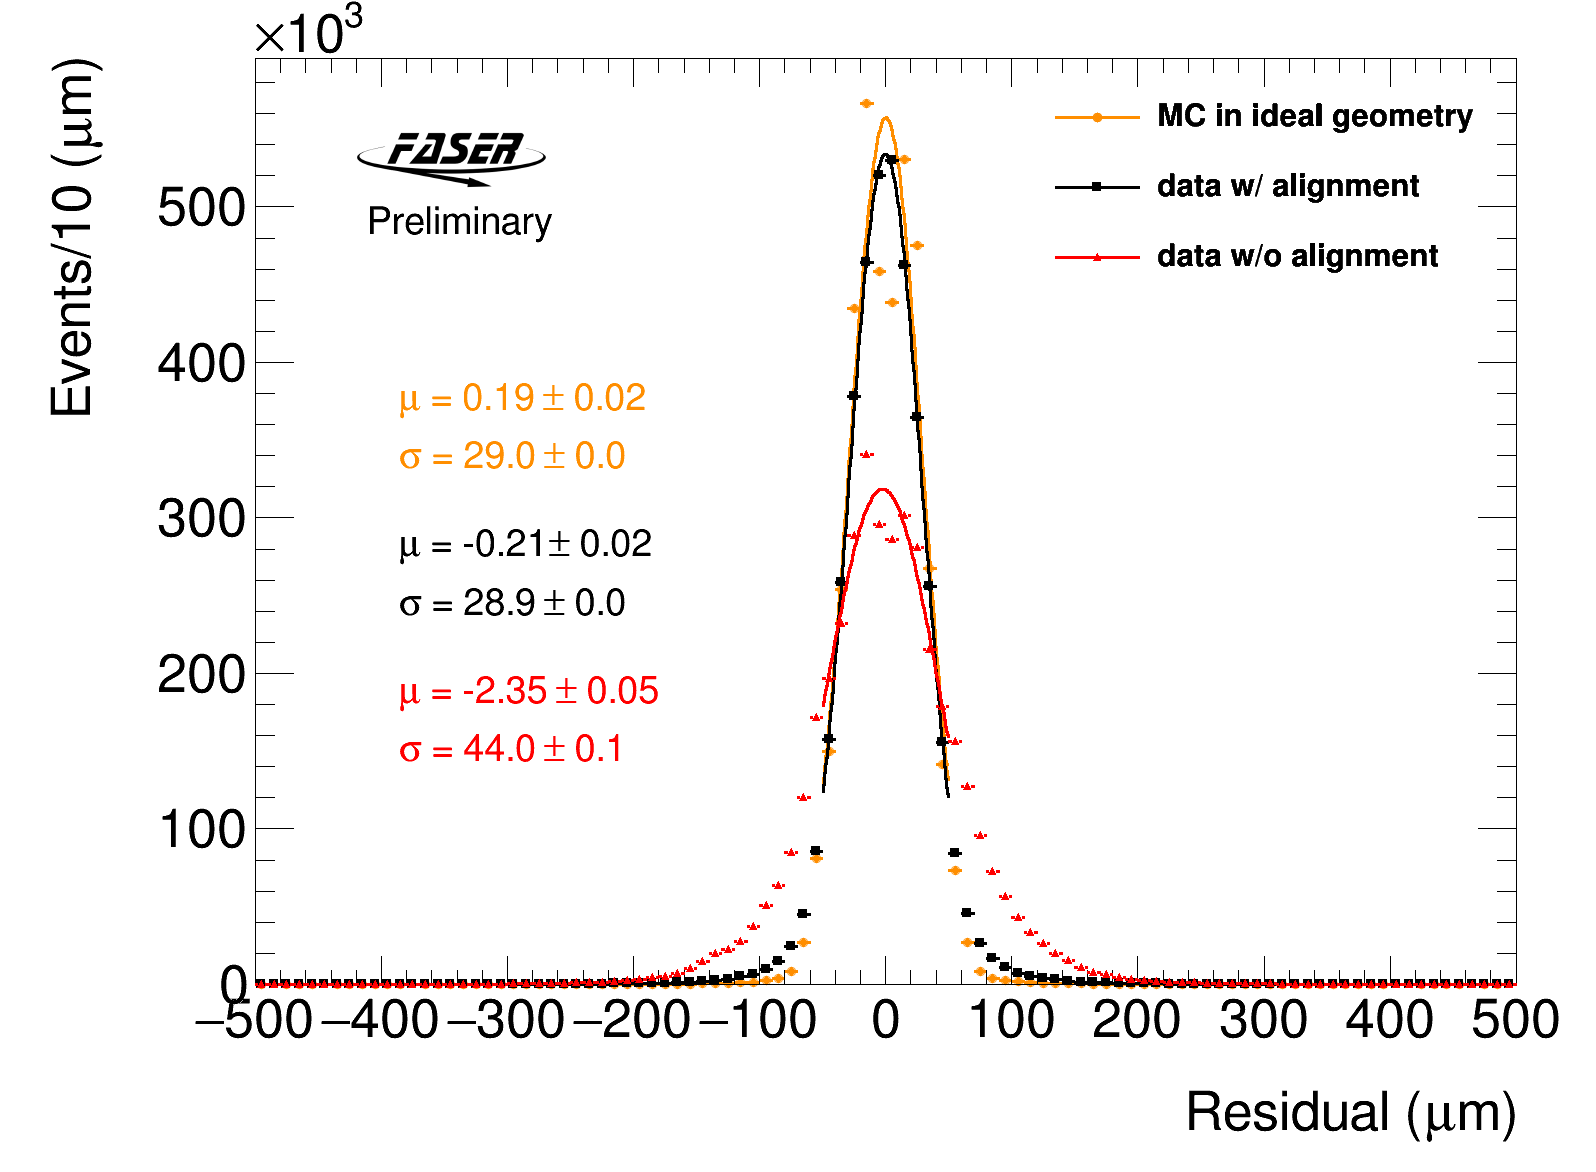
Comparison of track residual distributions
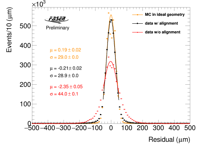
The distribution of residual from the tracks reconstructed from MC simulation in ideal geometry (orange), from data in original geometry (red), and from data in aligned geometry (black) with an integrated luminosity of 596 pb-1. Only the tracks with chi2 less than 200, momentum greater than 300 GeV, and the number of clusters greater than 14 are used. The distributions have been normalized to the same number of entries, and the two peaks around 20um from MC simulation is caused by the tracks which are perpendicular to the module and have discrete residual in the middle layer in each station due to the null magnetic field. Each distribution is fitted by a Gaussian function and the parameters are listed as a figure of merit. The residual is obtained by re-fit the track with the corresponding clusters in both sides of one module removed. The distribution from collision data is improved significantly with alignment and is approaching to the MC simulation in ideal geometry.
|
 |
Tracker |
Alignment |
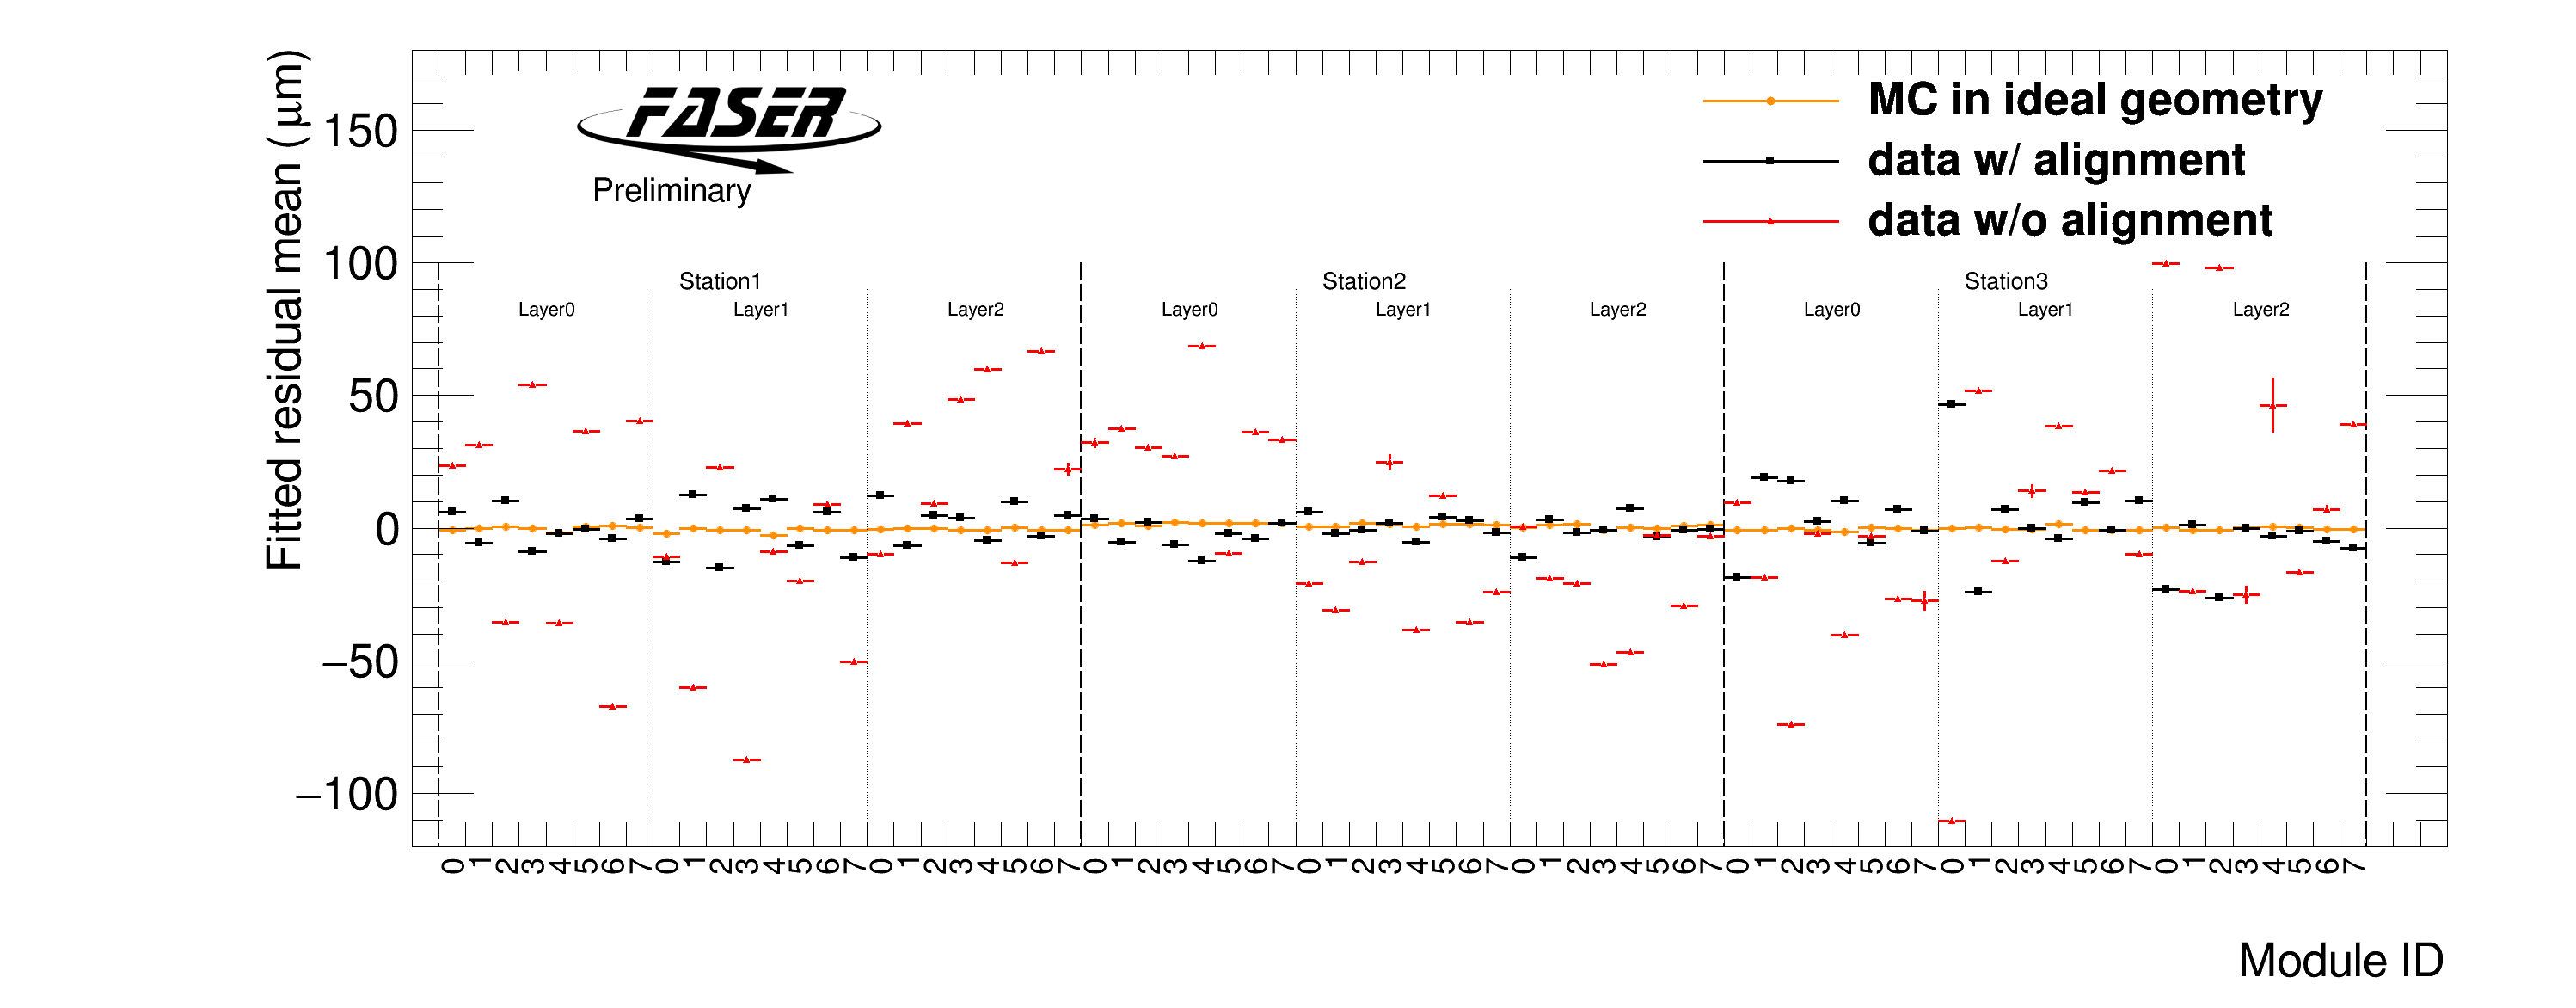
Comparison of the mean value of track residual distributions for each module
The distribution of the mean value of the residuals for each module from the tracks reconstructed from MC simulation in ideal geometry (orange), from data in original geometry (red), and from data in aligned geometry (black). The distributions have been normalized to the same number of entries. In the alignment iterations, the layer 1 at station 1 and station 3 are fixed to constrain the weak modes. The mean value is obtained by fitting each residual distribution with a Gaussian function and the error-bar represent the statistical error from the fit. The residual for all the modules are improved significantly with alignment and is approaching to the MC simulation in ideal geometry.
|
 |
Tracker |
Alignment |
Comparison of the standard deviation of track residual distributions for each module
The distribution of the standard deviation value of the residuals for each module from the tracks reconstructed from MC simulation in ideal geometry (orange), from data in original geometry (red), and from data in aligned geometry (black). The distributions have been normalized to the same number of entries. In the alignment iterations, the layer 1 at station 1 and station 3 are fixed to constrain the weak modes. The mean value is obtained by fitting each residual distribution with a Gaussian function and the error-bar represent the statistical error from the fit. The residual for all the modules are improved significantly with alignment and consistent to the MC simulation in ideal geometry.
|
 |
Tracker |
Calibration |
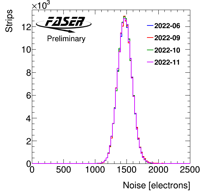
Comparison of tracker noise distributions
Comparison of noise (Equivalent Noise Charge, ENC) distributions of all four tracker stations on a linear scale. These are obtained by regular calibration runs in 2022 during LHC beam downtime. The shaper current of the chips is adjusted to obtain gain uniformity. Dead/noisy strips are removed from these plots. The total number of strips across all 4 stations is 147456. We obtained the following numbers in each run: 147393 in June, 147392 in September, 147392 in October and 147392 in November. We achieve stable operation with more than 99.9 % of all strips.
|
 |
Tracker |
Calibration |
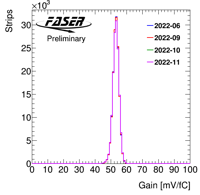
Comparison of tracker gain distributions
Comparison of gain distributions of all four tracker stations on a linear scale. These are obtained by regular calibration runs in 2022 during LHC beam downtime. The shaper current of the chips is adjusted to obtain gain uniformity. Dead/noisy strips are removed from these plots. The total number of the strips across all 4 stations is 147456. We obtained the following numbers in each run: 147393 in June, 147392 in September, 147392 in October and 147392 in November. We achieve stable operation with more than 99.9 % of all strips.
|
 |
Tracker |
Calibration |
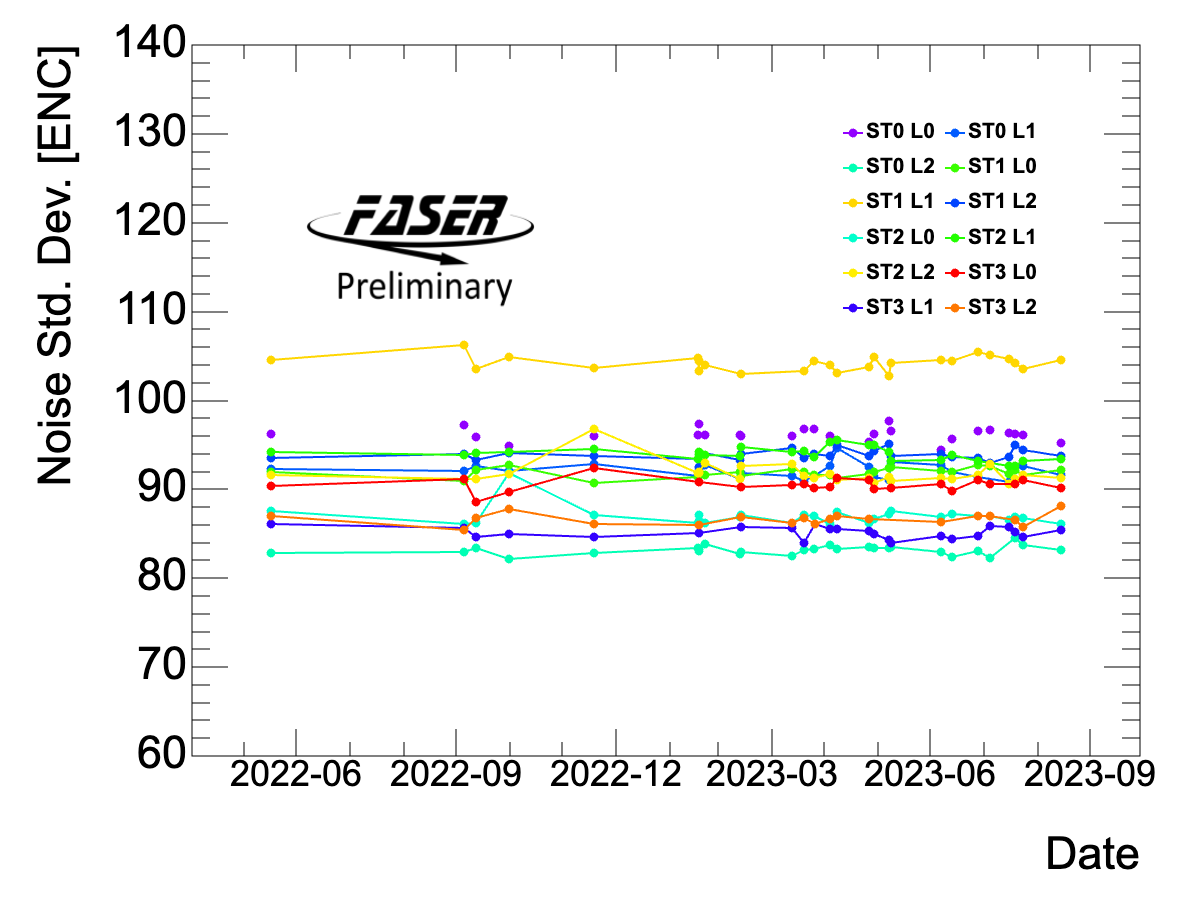
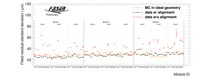
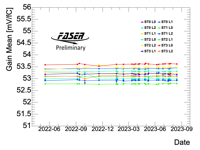
A history plot of Gain distributions of each tracker layer over 2 years operation from June 2022 to September 2023
Those are obtained by regular calibration runs in 2022 and 2023 during no LHC beam time. The main distribution is shown. Defective strips are removed from each distribution. The definition of the defective strips are following: (1) dead and noisy strips found by maskscan, (2) low gain strips with less than 40 mV/fC, (3) Low Equivalent Noise Charge (ENC) strips with less than 850 electrons and (4) untrimmable strips following a full range of trim scans. We have been achieving stable operation, keeping the consistency of the tracker performance.
|
 |
Tracker |
Calibration |
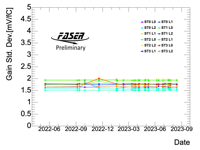
A history plot of Gain distributions of each tracker layer over 2 years operation from June 2022 to September 2023
Those are obtained by regular calibration runs in 2022 and 2023 during no LHC beam time. The standard deviation's distribution is shown. Defective strips are removed from each distribution. The definition of the defective strips are following: (1) dead and noisy strips found by maskscan, (2) low gain strips with less than 40 mV/fC, (3) Low Equivalent Noise Charge (ENC) strips with less than 850 electrons and (4) untrimmable strips following a full range of trim scans. We have been achieving stable operation, keeping the consistency of the tracker performance.
|
 |
Tracker |
Calibration |
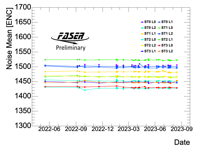
A history plot of Noise distributions of each tracker layer over 2 years operation from June 2022 to September 2023
Those are obtained by regular calibration runs in 2022 and 2023 during no LHC beam time. The mean distribution is shown. Defective strips are removed from each distribution. The definition of the defective strips are following: (1) dead and noisy strips found by maskscan, (2) low gain strips with less than 40 mV/fC, (3) Low Equivalent Noise Charge (ENC) strips with less than 850 electrons and (4) untrimmable strips following a full range of trim scans. We have been achieving stable operation, keeping the consistency of the tracker performance.
|
 |
Tracker |
Calibration |
A history plot of Noise distributions of each tracker layer over 2 years operation from June 2022 to September 2023
Those are obtained by regular calibration runs in 2022 and 2023 during no LHC beam time. The standard deviation's distribution is shown. Defective strips are removed from each distribution. The definition of the defective strips are following: (1) dead and noisy strips found by maskscan, (2) low gain strips with less than 40 mV/fC, (3) Low Equivalent Noise Charge (ENC) strips with less than 850 electrons and (4) untrimmable strips following a full range of trim scans. We have been achieving stable operation, keeping the consistency of the tracker performance.
|
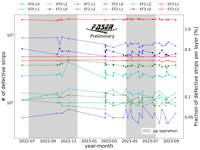 |
Tracker |
Calibration |
A history of defective strips in each layer from June 2022 to September 2023
The data are derived from regular calibration runs conducted in 2022 and 2023 when the LHC beam was not operational. The data-taking periods are shown as the gray hatches. The criteria for defining defective strips include: (1) dead and noisy strips identified by maskscan; (2) strips with low gain, exhibiting less than 40 mV/fC; (3) strips with low Equivalent Noise Charge (ENC), registering less than 850 electrons; and (4) untrimmable strips following a full range of trim scans. Station3 Layer0 has the most defective strips, which is almost clustered in one chip. This data demonstrates stable operation, with fewer than 400 strips deemed defective, equating to only 0.03% of the total. This indicates consistent performance of the tracker.
|
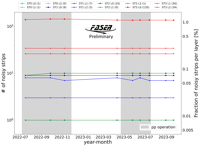 |
Tracker |
Calibration |
A history of noisy strips in each layer from June 2022 to September 2023
Those strips are classified as noisy due to high occupancy (more than 0.01) from data derived from physics or cosmic runs. The data-taking periods are shown as the gray hatches. Those strips are treated properly in offline analysis, by assigning their efficiencies are 100 %. The number of identified noisy strips are highly overlapped with the defective strips indicated from the standalone calibration while the LHC is not operational. This data demonstrates stable operation, with around 200 strips deemed noisy, equating to only 0.01% of the total. This indicates consistent performance of the tracker.
|
 |
Tracker |
Calibration |
Fine Time Scan for 2023 and 2024: Stations.
Fine time scan performance (time offset adjustment from the nominal physics data taking setting during the scan period) for binary hit patterns in each station of the tracking detector during the 2023 (blue) and 2024 (red) runs. The analysis used data from selected test runs, filtering for events with long tracks > 0, momentum > 100 GeV, number of hits ≥ 15, and within the magnet radius acceptance of r < 90 mm. A 0 ns offset corresponds to the nominal fine time setting for that specific data taking period. 01X patterns (011 or 010 binary hits recorded within this preferred timing window) are fitted to a top hat function. This fit determines the mean delay value of the timing processing for each station, reflecting the combined signal delays from all three layers within the station. Due to the summing of layers, some signal delays share different hit pattern fractions. Each station’s fit is performed using a global fit that incorporates data from all layers.
|
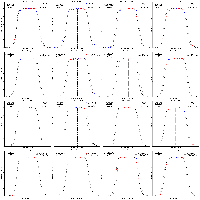 |
Tracker |
Calibration |
Fine Time Scan for 2023 and 2024: Layers.
Fine time scan (time offset adjustment from the nominal physics data taking setting during the scan period) performance for binary hit patterns in each layer of every station of the tracking detector during 2023 (blue) and 2024 (red) runs. The analysis utilized data from selected test runs, filtering for events with long tracks > 0, momentum > 100 GeV, number of hits ≥ 15, and within the magnet radius acceptance of r < 90 mm. A 0 ns offset corresponds to the nominal fine time setting for that specific data taking period. 01X patterns, representing either 011 or 010 binary hits recorded within the preferred timing window, are fitted to a top hat function. This fit determines the mean delay value of the timing processing in each layer. For all layers within a station plots, the sum of all different signal delays measured in all three layers results in some signal delays sharing different hit pattern fractions. The fit for all layers within a station is performed using a global fit that incorporates all data.
|
 |
Tracker |
Calibration |
Fine Time Scan for 2023 and 2024: Stations and all Patterns.
Fine time scan performance (time offset adjustment from the nominal physics data taking setting during the scan period) for binary hit patterns in each station of the tracking detector during the 2023 (diamond) and 2024 (cross) runs. The analysis utilized data from selected test runs, filtering for events with long tracks > 0, momentum > 100 GeV, number of hits ≥ 15, and within the magnet radius acceptance of r < 90 mm. A 0 ns offset corresponds to the nominal fine time setting for that specific data taking period. 01X patterns (green), representing either 011 or 010 binary hits recorded within the preferred timing window, are fitted to a top hat function. This fit determines the mean delay value of the timing processing for each station. The 1XX patterns (red), encompassing 100, 101, 110, and 111 binary hits, indicate events processed early, necessitating a positive delay offset. Conversely, the 001 pattern (blue) signifies signals processed late, requiring a negative time shift. This is a sum of all the different signal delays measured in all three layers in each station, resulting in some signal delays sharing different hit pattern fractions. The fit for each station is performed using a global fit that incorporates data from all layers.
|
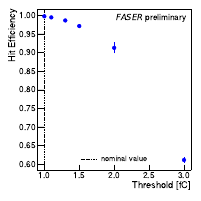 |
Tracker |
FirstData |
SCT threshold scan
The hit efficiency as a function of the applied hit threshold (in fC) for the FASER silicon strip (SCT) tracker. The efficiency falls off as the threshold is increased. The nominal threshold setting of 1 fC is shown as a dashed line, and yields an average hit efficiency across the full tracker of 99.64 ± 0.10 %. This plot was made using data taken in dedicated FASER runs, where the tracker settings were changed, during LHC collisions in July 2022.
|
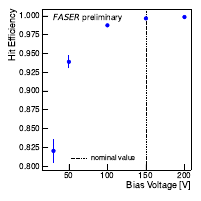 |
Tracker |
FirstData |
SCT bias voltage scan
The hit efficiency as a function of the applied bias voltage (in fC) for the FASER silicon strip (SCT) tracker. The efficiency falls off as the bias voltage is reduced. The nominal setting of 150 V is shown as a dashed line, and yields an average hit efficiency across the full tracker of 99.64 ± 0.10 %. These plots were made using data taken in dedicated FASER runs, where the tracker settings were changed, during LHC collisions in July 2022.
|
 |
Tracker |
FirstData |
SCT fine time scan
The fraction of tracker hits with good timing (the so called 01X pattern where the tracker hit across the three 25 ns time bins read out shows no hit in the first bin, a hit in the second bin, and has no requirement on the third bin) as a function of the fine time delay applied in the tracker readout (in ns). This fraction is shown for the 4 FASER tracker stations, with the fine time delay used in operations shown as a dashed line. As can be seen, the settings for all tracker stations give the maximum fraction of hits with good timing. These plots were made using data taken in dedicated FASER runs, where the tracker timing settings were changed, during LHC collisions in July 2022.
|
 |
Tracker |
HitMaps |
Space Point Hit Maps (Stations)
Hit maps of the reconstructed space points. 236 noisy strips (<0.2% of all strips) with an occupancy larger 1% have been masked. Stations are ordered from 0 to 3 going from upstream to downstream. Each station is composed of three planes with eight ATLAS Semiconductor Tracker (SCT) barrel modules per plane, arranged in two columns of four modules. The active area of the modules from both columns overlaps in the center by 2mm causing the yellow stripes with more space points at x = 0mm. The distance between the sensor cut edge and the sensitive region is 1mm. This results in a dead region of about 2mm between modules at y = -64mm, 0mm and 64mm. To overcome this, the three planes are staggered along the vertical direction with a relative shift of the middle (last) plane of +5mm (-5mm) with respect to the first plane. Each SCT barrel module consists of four identical single-sided silicon microstrip sensors glued in pairs on the two sides of a module. This causes the two green stripes with fewer events at at x = -62mm and 62mm. The area with fewer space points in the top right module in station 3, layer 0 is caused by one noisy chip with many masked strips. These plots were made using data from LHC fill 8491, corresponding to an integrated luminosity of 559.8pb-1.
|
 |
Tracker |
HitMaps |
Space Point Hit Maps (Layers)
Hit maps of the reconstructed space points where strips with an occupancy larger 1% have been masked. Stations are ordered from 0 to 3 and layers from 0 to 2 going from upstream to downstream. 236 noisy strips (<0.2% of all strips) with an occupancy larger 1% have been masked. Each plane consists of eight ATLAS Semiconductor Tracker (SCT) barrel modules, arranged in two columns of four modules. The active area of the modules from both columns overlaps in the center by 2mm causing the yellow stripes with more space points at x = 0mm. The distance between the sensor cut edge and the sensitive region is 1mm. This results in a dead region of about 2mm between modules at y = -64mm, 0mm and 64mm. To overcome this, the three planes are staggered along the vertical direction with a relative shift of the middle (last) plane of +5mm (-5mm) with respect to the first plane. Each SCT barrel module consists of four identical single-sided silicon microstrip sensors glued in pairs on the two sides of a module. This causes the two green stripes with fewer events at at x = -62mm and 62mm. The dead area in the top right module in station 3, layer 0 is caused by one noisy chip with many masked strips. These plots were made using data from LHC fill 8491, corresponding to an integrated luminosity of 559.8pb-1.
|
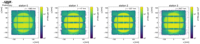 |
Tracker |
HitMaps |
Track Measurement Hit Maps (Stations)
Track measurement position for tracks with a momentum larger 10GeV and hits in at least 7 layers. Stations are ordered from 0 to 3 going from upstream to downstream. Each station is composed of three planes with eight ATLAS Semiconductor Tracker (SCT) barrel modules per plane, arranged in two columns of four modules. The active area of the modules from both columns overlaps in the center by 2mm causing the yellow stripes with more space points at x = 0mm. The distance between the sensor cut edge and the sensitive region is 1mm. This results in a dead region of about 2mm between modules at y = -64mm, 0mm and 64mm. To overcome this, the three planes are staggered along the vertical direction with a relative shift of the middle (last) plane of +5mm (-5mm) with respect to the first plane. Each SCT barrel module consists of four identical single-sided silicon microstrip sensors glued in pairs on the two sides of a module. This causes the two green stripes with fewer events at at x = -62mm and 62mm. The stations are located between three 0.57T dipole magnets with an aperture radius of 100mm. The inhomogeneous magnetic field and multiple scattering in the magnet material outside this aperture result in fewer hits in this region. The area with fewer space points in the top right module in station 3, layer 0 is caused by one noisy chip with many masked strips. These plots were made using data from LHC fill 8491, corresponding to an integrated luminosity of 559.8pb-1.
|
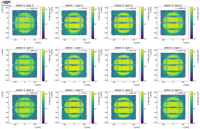 |
Tracker |
HitMaps |
Space Point Hit Maps (Layers)
Track measurement position for tracks with a momentum larger 10GeV and hits in at least 7 layers. Stations are ordered from 0 to 3 and layers from 0 to 2 going from upstream to downstream. Each plane consists of eight ATLAS Semiconductor Tracker (SCT) barrel modules, arranged in two columns of four modules. The active area of the modules from both columns overlaps in the center by 2mm causing the yellow stripes with more space points at x = 0mm. The distance between the sensor cut edge and the sensitive region is 1mm. This results in a dead region of about 2mm between modules at y = -64mm, 0mm and 64mm. To overcome this, the three planes are staggered along the vertical direction with a relative shift of the middle (last) plane of +5mm (-5mm) with respect to the first plane. Each SCT barrel module consists of four identical single-sided silicon microstrip sensors glued in pairs on the two sides of a module. This causes the two green stripes with fewer events at at x = -62mm and 62mm. The stations are located between three 0.57T dipole magnets with an aperture radius of 100mm. The inhomogeneous magnetic field and multiple scattering in the magnet material outside this aperture result in fewer hits in this region. The area with fewer space points in the top right module in station 3, layer 0 is caused by one noisy chip with many masked strips. These plots were made using data from LHC fill 8491, corresponding to an integrated luminosity of 559.8pb-1.
|